They say hope springs eternal. That's especially true in the late stages of a bull market, when the memories of easy gains and the fear of being left out of the party masks a turning point in corporate profits and economic growth.
Now, to be clear, I'm not saying this bull market is ending — Tuesday’s strong rally, powered by rising oil prices and renewed hopes for a Greek debt deal, certainly didn’t look like the last gasps. But the optimism represented in that 1.4 percent rally in the S&P 500 and in persistently high levels of investor confidence might belie the current situation on the ground.
Related: What Will It Take for the Bull Market to Power Through 2015?
You can see this in the way that the current spread between bulls and bears in the Investors Intelligence surveys remains around 40 percent despite the S&P 500's flat performance since September. Traditionally, market performance and confidence go hand-in-hand. When it doesn't, it suggests a turning point could be near.
According to an analysis by Jason Goepfert at SentimenTrader, prior occurrences of excessive confidence in the face of tepid market results has "led to significantly weak returns" going forward. Examples include 1976/1977, 2000 and 2007. Admittedly, there have also been a few false alarms. Overall, since 1975 there have been 18 other times something like this has happened.
Yet after crunching the numbers, Goepfert finds that the median one-year performance in the S&P 500 was -5.0 percent in such instances vs. +9.4 percent for any given one-year period during this time.
There's more.
Active investment managers, as measured by the National Association of Active Investment Managers, recently returned to being more than 90 percent exposed to stocks. If that weren't enough, the most bearish manager is not shorting while the most bullish is 200 percent long (i.e., using leverage).
Related: 2015 Already Looks Like Trouble for the Markets
This confidence is surprising given just how many issues are in play right now, from the new anti-bailout/anti-austerity government in Greece to recent currency market volatility to the collapse of energy prices to economic slowdowns in Europe and Asia and the specter of the first interest rate hike from the Federal Reserve since 2006. And what about corporate earnings growth, which as I recently discussed is set to disappoint? Or the downright scary collapse in long-term government bond yields possibly warning of a debt-deflation nightmare, which I also recently discussed?
Of course, markets can separate from reality for extended periods of time, whether it was Las Vegas condos 10 years ago, dotcom stocks 20 years ago or the Semper Augustus tulip more than 600 years ago. But even here, stocks are warnings of trouble. The U.S. stock market has separated from what's happening in the rest of the world.

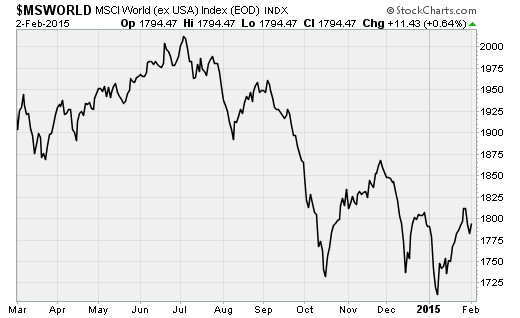
Consider that the MSCI World (ex USA) Index (MSWORLD) peaked in early July — right before U.S. markets closed for the Independence Day holiday — and is since down 11 percent from that high amid a pattern of lower highs and lower lows. The iShares Emerging Markets (EEM) is down more than 12 percent from the highs set in early September. The Europe 350 iShares (IEV) is down 12 percent from the highs set in June.
You get the idea.
Related: The Great Decoupling — Why the U.S. Is Divorcing Global Markets
Mainly, setting aside a discussion on earnings, economic fundamentals or even central banks can maintain the mirage of infallibility; the stock market is actually weaker than it looks. That alone should be a cause for concern even amongst the most starry-eyed of investors.
Take, for example, the technology sector, which embodies the very heart and soul of the perennial optimists. Currently, only 25 percent of the components of the Technology Select SPDR (XLK) are above their 50-day moving average — a measure of medium-term trend.

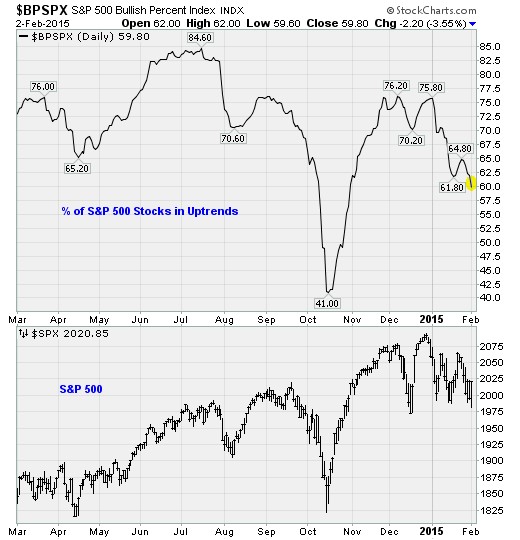
Backing up, the overall market is sending the same message. The S&P 500 Bullish Percent Index, which measures the percentage of the index's components that are in uptrends, fell below 60 percent on Monday (despite a broad market bounce) for the first time since October. That's down from highs near 76 percent in December and a peak of nearly 85 percent back in July.
The chart above illustrates this, comparing the percentage of S&P 500 stocks in uptrends (top pane) to the S&P 500 itself (bottom pane).
Related: Americans’ 401(k) Totals Just Hit a New Record. Don’t Celebrate Yet…
Increasingly, it's becoming clear that a majority of the market peaked last summer and we've been cruising on fumes ever since, increasingly reliant on fewer and fewer stocks to hold the major U.S. stock market averages aloft. Without a major correction, sentiment has remained intact. But that's not a sustainable situation.
Either investor ebullience translates into more widespread and aggressive buying of stocks, or the situation takes a turn for the worse and sends a few shockwaves of panic selling to reset the situation. In the process, the bubble of the inevitability of stock market gains — a consequence of the fact there has been no 10 percent plus correction in the S&P 500 since early 2012 — will be burst.
Top Reads from The Fiscal Times:
- First Greece, Now Spain: Is Europe in for a Political Earthquake?
- Obama’s New Tax Plan: So Much for Middle Class Economics
- 10 Surprising Tax Deductions in 2015


