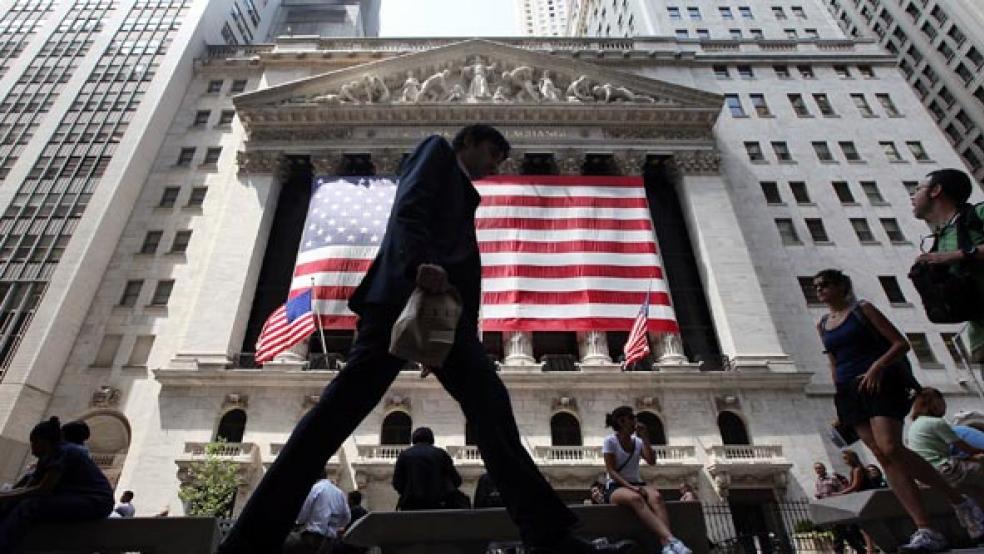
Yet another round of weak economic news set off yet a new stock-market rout on Thursday, with the Dow Jones Industrial Average sliding 3.7 percent, the Standard & Poor’s 500-stock index dropping 4.5 percent and the Nasdaq plunging 5.2 percent. Here’s a quick look at the toll of the most recent Wall Street turmoil:
15.2 percent
Decline in the S&P 500 since July 22
16.4 percent
Decline in the S&P 500 from its April 29 closing high for the year
13.3 percent
Decline in the Dow Jones Industrial Average since July 22
14.2 percent
Decline in the Dow Jones Industrial Average from its April 29 closing high for the year
22.4 percent
Decline in the Dow Jones Industrial Average from its all-time high, reached on October 9, 2007
5.07 percent
Decline in the Dow Jones Industrial Average since the beginning of the year
9.3 percent
Decline in the S&P 500 since the beginning of the year
10.27 percent
Decline in the Nasdaq Composite Index since the beginning of the year
4
Standard & Poor’s sectors that have lost at least 20 percent since April 29. Financials have led the decline, dropping nearly 25 percent, while industrials are off nearly 24 percent. The energy and materials sector have each lost 20 percent
44.24
Reading of the VIX, Wall Street’s so-called fear gauge, as of the stock market’s close on August 18
48
Reading of the VIX as of the stock market’s close on August 8, when the S&P 500 dropped 6.67 percent
80.86
All-time closing high for the VIX, set on November 20, 2008
2.08 percent
Yield on 10-year Treasuries, just above the record low
$1,822
Closing price of gold futures for December delivery, per ounce—a nominal record closing high
$1.87 trillion
Value lost by S&P 500 companies since July 22
$5.3 trillion
Value lost in global markets since July 22


