Major League Baseball teams have found out time and again that they can’t just buy a World Series title.
Baseball payrolls are usually most impactful at the extremes: too low and a team can’t afford enough talent for continued success, sky high and the club is likely spending foolishly.
With baseball taking its All-Star break this week, and with the trade deadline approaching, every team can take a breather at the approximate midpoint to assess themselves and their playoff hopes. The break is also a convenient point to assess the relationship between payroll and on-field success, which BMO Bank does every year.
Related: The 27 Highest Paid Baseball Players — Are They Worth It?
The “Moneyball” philosophy popularized by the small market Oakland Athletics, which prioritizes maximum efficiency by collecting small salaried players with outsized value, has been adopted in some form by every team. MLB is sole among the four major sports leagues with no salary cap to protect the owners from spending exorbitant amounts on players, yet each club prizes the ability to lure and pay top talent — a luxury every team wants.
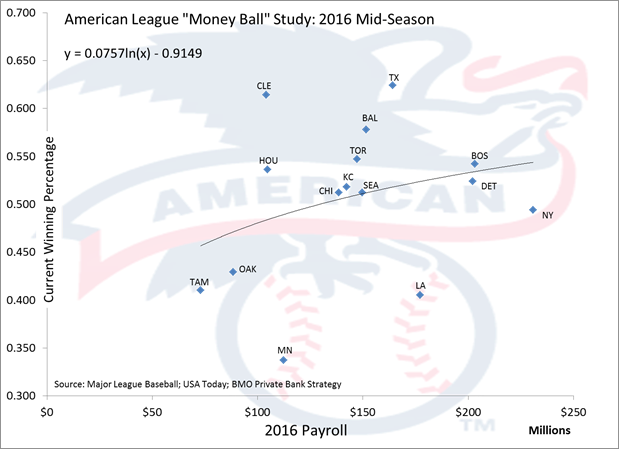
The 2016 BMO report shows that teams with higher payrolls have generally been more successful. An upward sloping line shows that paying for talent works.
But as always, there are exceptions.

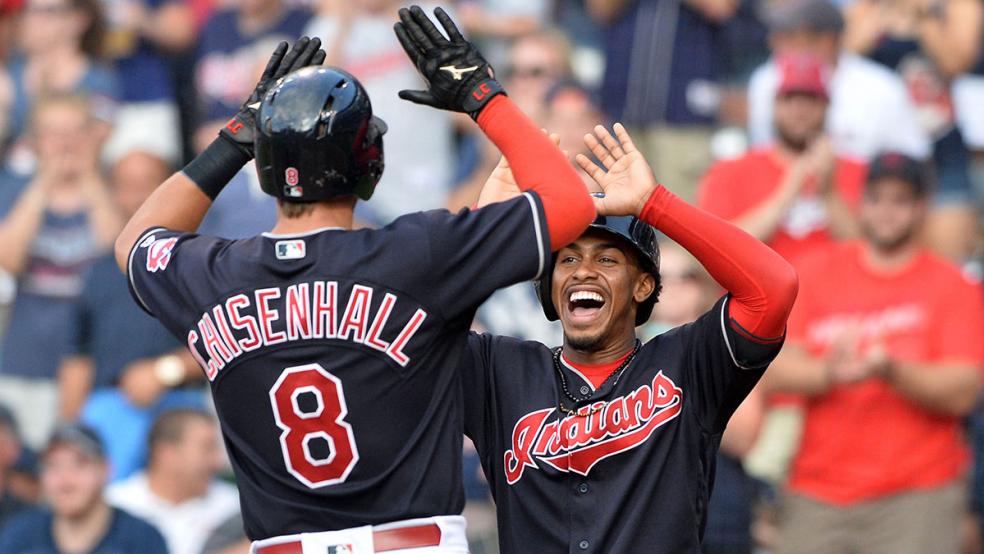
The big winner in bang for the buck in the American League is the $104 million payroll Cleveland Indians. Their roster makes $70 million less than the American League’s $177 million median, yet has been good for a .591 winning percentage and first place in the Central Division.
Contrast the Indians’ 2016 success with the Boston Red Sox, a team that is also winning but has spent big getting there. Entering the All-Star break, Boston carried the third-highest payroll in the game, $203 million, which has been good for a .563 winning percentage and second place in the East.
The Red Sox trail the Baltimore Orioles, which has a $151 million payroll and a .586 winning percentage. In the ultra-competitive division, the Orioles are as of now besting their bigger market rivals in Boston and New York.
Related: Major League Baseball 2016 — The State of the Sport by the Numbers
The Yankees in particular are a good example of a big payroll yielding relatively small results. Long the leader in payroll and a perennial playoff team, the 2016 Bronx Bombers are saddled with aging players and large, but expiring, contracts. Right now, the team is not getting much in return for their $230 million investment. The Yankees have struggled to stay above .500 and entered the break with a 44-44 record.
Other big losers are the Minnesota Twins and Los Angeles Angels. The Twins $112 million payroll has only been good for 32 wins and a .364 winning percentage and the Angels’ $177 million has won the club 37 games and a .416 percentage.
The report found that in the American League each win costs about $12.5 million.
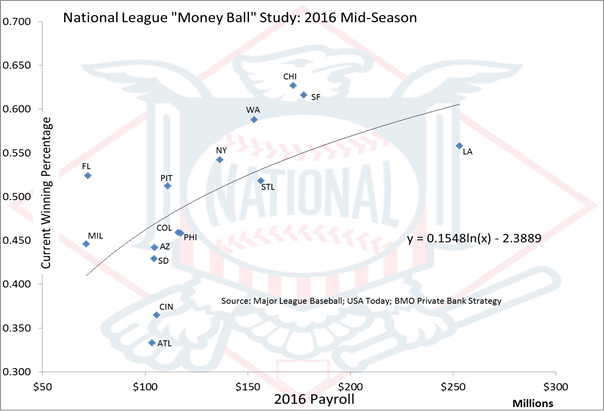
In the National League, the relationship between payroll and winning is clearer and top spenders are winning more than their cheaper competitors.

The Miami Marlins are getting the National League’s best return on investment. Miami’s tiny $72 million team budget has been good for 47 wins, a .534 winning percentage and a tie for second place in the NL East.
Another success story is the Washington Nationals. Their just-above-league-median $153 million payroll has earned the club a very strong 54 wins, a .600 winning percentage and first place.
Related: Should Baseball Players Get Overtime Pay? Congress Aims a Beanball at Minor Leaguers
The biggest losers in the National League are the Atlanta Braves and Cincinnati Reds. Though both clubs haven’t spent like a poet on payday — Atlanta’s payroll is $103 million and Cincinnati’s is $105 — neither team is getting many wins in return. The Braves are wallowing in the East Division cellar with a .348 winning percentage and the Reds are also dead last, with only one more win and a .360 winning percentage.
The study determined that in the National League wins are slightly less expensive than in the junior circuit, costing about $5 million apiece.
As 2016’s payroll numbers show, big budgets are strongly correlated with winning but the relationship is not causal, which leaves MLB general managers and owners with this lesson: spend, yes, but spend wisely.


