Automakers Are Having a Record Year, but Here’s a Trend that Should Worry Them

U.S. auto sales closed out the summer on a positive note, topping estimates and casting some rosy light on the health of the American consumer. Recording its best August since 2003, the auto industry is on pace to sell 17.8 vehicles in 2015, well ahead of expectations of 17.3 million. If the numbers hold up, 2015 will be the best year ever for U.S. auto sales, beating the 17.4 million mark set in 2000.
The general consensus is that auto industry is in pretty good shape these days. Gas prices and interest rates are low, boosting the market for cars and light trucks. More than 2 million jobs were added to the U.S. economy in the past year, and more jobs is usually good news for auto sales. The unemployment rate has been trending lower for five years, sitting at a relatively healthy 5.3 percent in July.
Related: What's Next for Oil Prices? Look Out Below!
As with any statistic, though, there’s more than one way to look at the situation. Sure, auto sales are climbing as the economy gets stronger and more Americans hit their local car dealers’ lots. At least to some degree, though, higher auto sales should be expected just as a result of U.S. population growth. And those rising monthly sales figures are masking a continuing trend that is more worrisome for the auto industry: per capita auto sales are still in a long-term decline, even including the solid growth the industry has seen since the end of the recession. Doug Short at Advisor Perspectives did the math and made a graph:

According to Short’s analysis, the peak year for per capita auto sales in the U.S. was 1978. As the red line in the graph shows, the trend is negative since then.
In the graph, per capita auto sales in January, 1976, were defined as 100; the readings in the index since then are relative to that 1976 sales level. As you can see, the index moves higher until August of 1978, when per capita auto sales were up nearly 20 percent over 1976. Since then, per capita auto sales have fallen, reaching a low in 2009 that was nearly 50 percent lower than 1976. Since 2009, per capita auto sales have risen nicely, but are still more than 15 percent below peak.
What could explain the negative trend? Two factors come to mind. First, demographics. It has been widely reported that the millennial generation is less interested in owning cars for a variety of reasons, ranging from a weak economy to a cultural shift away from suburban life. However, the data on millennial car purchases is ambiguous; recently, millennials have started buying cars in volumes that look a lot like their elders. And even if millennials are less interested in buying cars, their preferences can’t explain a shift that began in the 1970s, before they were born.
Related: U.S. Companies Are Dying Faster Than Ever
The other factor that may explain the trend is income inequality. A study of car ownership by the Carnegie Foundation found that countries with higher income inequality have fewer cars per capita. The logic is simple: As more income is claimed by the wealthy, there’s less to go around for everyone else. And that means there’s less money for middle and lower income groups to buy and maintain automobiles, among other things.
Here’s a chart of the Gini index for the U.S. since 1947. (The Gini Index is a widely-used measure of income inequality. A higher Gini number means higher inequality.) Note that the Gini reading started climbing in the late ‘70s – the same time when per capita car ownership in the U.S. began to fall.
This chart tells us, not for the first time, that the U.S. has experienced more income inequality since the 1970s. Combined with the per capita auto sales data above, it suggests that as the rich have gotten richer and everyone else has struggled to keep up, car ownership has suffered. Although this is by no means proof of the relationship between income inequality and per capita car ownership over the last 40 years, it hints at an interesting theory – and suggests that the auto industry has good reason to be concerned about growing inequality in the U.S.

Top Reads From The Fiscal Times:
- 6 Reasons Gas Prices Could Fall Below $2 a Gallon
- Hoping for a Raise? Here’s How Much Most People Are Getting
- What the U.S. Must Do to Avoid Another Financial Crisis
Chart of the Day: High Deductible Blues

The higher the deductible in your health insurance plan, the less happy you probably are with it. That’s according to a new report on employer-sponsored health insurance from the Kaiser Family Foundation and the Los Angeles Times.
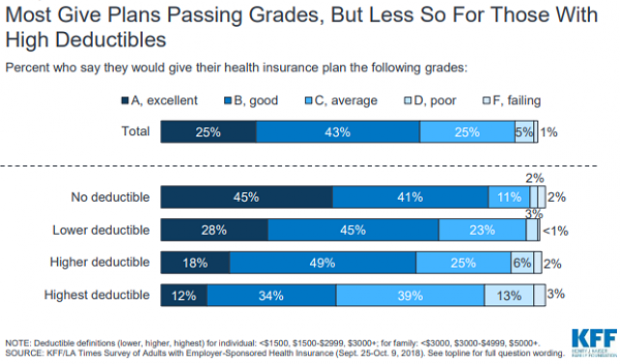
Chart of the Day: Tax Cuts and the Missing Capex Boom

Despite the Republican tax overhaul, businesses aren’t significantly increasing their capital expenditures. “The federal government will have to borrow an added $1 trillion through 2027 to pay for the corporate tax breaks,” says Bloomberg’s Mark Whitehouse. “So far, it’s hard to see what the country is getting in return.”
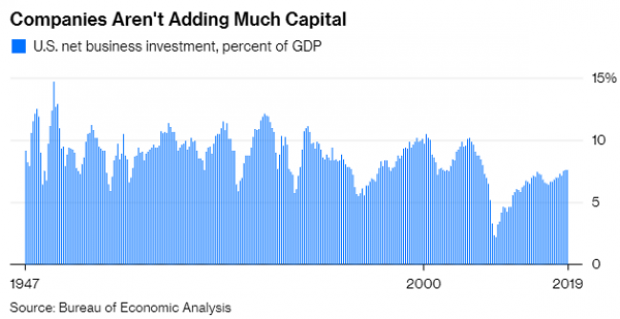
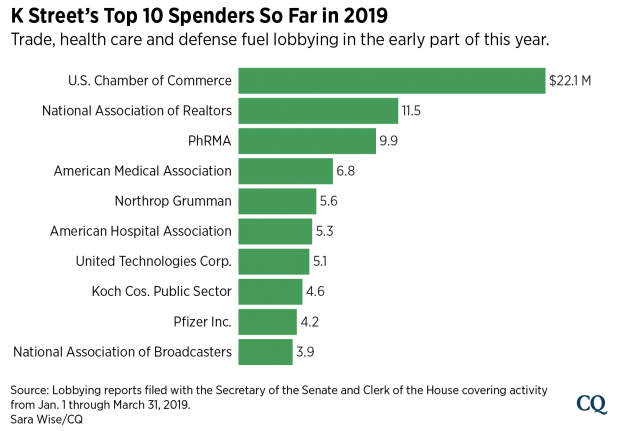
Chart of the Day: 2019’s Lobbying Leaders

Roll Call reports that trade, infrastructure and health care issues including prescription drug prices “dominated the lobbying agendas of some of the biggest spenders on K Street early this year.” Here’s Roll Call’s look at the top lobbying spenders so far this year:
Can You Fix Social Security? A New Tool Lets You Try

The Congressional Budget Office released an interactive tool Wednesday that shows how some widely discussed policy changes would affect the long-run financial health of the Social Security system.
“This interactive tool allows the user to explore seven policy options that could be used to improve the Social Security program’s finances and delay the trust funds’ exhaustion,” CBO said. “Four options would reduce benefits, and three options would increase payroll taxes. The tool allows for any combination of those options. It also lets the user change implementation dates and choose whether to show scheduled or payable benefits. … The tool also shows the impact of the options on different groups of people.”
Click here to view the interactive tool on the CBO website.
Why Prescription Drug Prices Keep Rising – and 3 Ways to Bring Them Down

Prescription drug prices have been rising at a blistering rate over the last few decades. Between 1980 and 2016, overall spending on prescription drugs rose from about $12 billion to roughly $330 billion, while its share of total health care spending doubled, from 5% to 10%.
Although lawmakers have shown renewed interest in addressing the problem, with pharmaceutical CEOs testifying before the Senate Finance Committee in February and pharmacy benefit managers (PBMS) scheduled to do so this week, no comprehensive plan to halt the relentless increase in prices has been proposed, let alone agreed upon.
Robin Feldman, a professor at the University of California Hastings College of Law, takes a look at the drug pricing system in a new book, “Drugs, Money and Secret Handshakes: The Unstoppable Growth of Prescription Drug Prices.” In a recent conversation with Bloomberg’s Joe Nocera, Feldman said that one of the key drivers of rising prices is the ongoing effort of pharmaceutical companies to maintain control of the market.
Fearing competition from lower-cost generics, drugmakers began over the last 10 or 15 years to focus on innovations “outside of the lab,” Feldman said. These innovations include paying PBMs to reduce competition from generics; creating complex systems of rebates to PBMs, hospitals and doctors to maintain high prices; and gaming the patent system to extend monopoly pricing power.
Feldman’s research on the dynamics of the drug market led her to formulate three general solutions for the problem of ever-rising prices:
1) Transparency: The current system thrives on secret deals between drug companies and middlemen. Transparency “lets competitors figure out how to compete and it lets regulators see where the bad behaviors occur,” Feldman says.
2) Patent limitations: Drugmakers have become experts at extending patents on existing drugs, often by making minor modifications in formulation, dosage or delivery. Feldman says that 78% of drugs getting new patents are actually old drugs gaining another round of protection, and thus another round of production and pricing exclusivity. A “one-and-done” patent system would eliminate this increasingly common strategy.
3) Simplification: Feldman says that “complexity breeds opportunity,” and warns that the U.S. “drug price system is so complex that the gaming opportunities are endless.” While “ruthless simplification” of regulatory rules and approval systems could help eliminate some of those opportunities, Feldman says that the U.S. doesn’t seem to be moving in this direction.
Read the full interview at Bloomberg News.