Automakers Are Having a Record Year, but Here’s a Trend that Should Worry Them

U.S. auto sales closed out the summer on a positive note, topping estimates and casting some rosy light on the health of the American consumer. Recording its best August since 2003, the auto industry is on pace to sell 17.8 vehicles in 2015, well ahead of expectations of 17.3 million. If the numbers hold up, 2015 will be the best year ever for U.S. auto sales, beating the 17.4 million mark set in 2000.
The general consensus is that auto industry is in pretty good shape these days. Gas prices and interest rates are low, boosting the market for cars and light trucks. More than 2 million jobs were added to the U.S. economy in the past year, and more jobs is usually good news for auto sales. The unemployment rate has been trending lower for five years, sitting at a relatively healthy 5.3 percent in July.
Related: What's Next for Oil Prices? Look Out Below!
As with any statistic, though, there’s more than one way to look at the situation. Sure, auto sales are climbing as the economy gets stronger and more Americans hit their local car dealers’ lots. At least to some degree, though, higher auto sales should be expected just as a result of U.S. population growth. And those rising monthly sales figures are masking a continuing trend that is more worrisome for the auto industry: per capita auto sales are still in a long-term decline, even including the solid growth the industry has seen since the end of the recession. Doug Short at Advisor Perspectives did the math and made a graph:

According to Short’s analysis, the peak year for per capita auto sales in the U.S. was 1978. As the red line in the graph shows, the trend is negative since then.
In the graph, per capita auto sales in January, 1976, were defined as 100; the readings in the index since then are relative to that 1976 sales level. As you can see, the index moves higher until August of 1978, when per capita auto sales were up nearly 20 percent over 1976. Since then, per capita auto sales have fallen, reaching a low in 2009 that was nearly 50 percent lower than 1976. Since 2009, per capita auto sales have risen nicely, but are still more than 15 percent below peak.
What could explain the negative trend? Two factors come to mind. First, demographics. It has been widely reported that the millennial generation is less interested in owning cars for a variety of reasons, ranging from a weak economy to a cultural shift away from suburban life. However, the data on millennial car purchases is ambiguous; recently, millennials have started buying cars in volumes that look a lot like their elders. And even if millennials are less interested in buying cars, their preferences can’t explain a shift that began in the 1970s, before they were born.
Related: U.S. Companies Are Dying Faster Than Ever
The other factor that may explain the trend is income inequality. A study of car ownership by the Carnegie Foundation found that countries with higher income inequality have fewer cars per capita. The logic is simple: As more income is claimed by the wealthy, there’s less to go around for everyone else. And that means there’s less money for middle and lower income groups to buy and maintain automobiles, among other things.
Here’s a chart of the Gini index for the U.S. since 1947. (The Gini Index is a widely-used measure of income inequality. A higher Gini number means higher inequality.) Note that the Gini reading started climbing in the late ‘70s – the same time when per capita car ownership in the U.S. began to fall.
This chart tells us, not for the first time, that the U.S. has experienced more income inequality since the 1970s. Combined with the per capita auto sales data above, it suggests that as the rich have gotten richer and everyone else has struggled to keep up, car ownership has suffered. Although this is by no means proof of the relationship between income inequality and per capita car ownership over the last 40 years, it hints at an interesting theory – and suggests that the auto industry has good reason to be concerned about growing inequality in the U.S.

Top Reads From The Fiscal Times:
- 6 Reasons Gas Prices Could Fall Below $2 a Gallon
- Hoping for a Raise? Here’s How Much Most People Are Getting
- What the U.S. Must Do to Avoid Another Financial Crisis
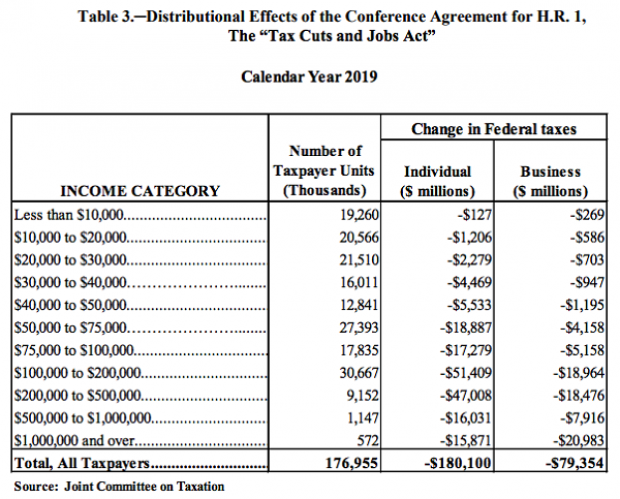
Majority of Tax Cuts Going to Filers Earning More Than $100K: JCT

Ahead of a House Ways and Means Committee hearing scheduled for Wednesday, the Joint Committee on Taxation prepared an analysis of the distributional effects of the 2017 Republican tax bill. The New York Times’ Jim Tankersley highlighted the fact that according to the JCT analysis, about 75 percent of the individual and business benefits of the tax cuts will go to filers earning more than $100,000 in 2019. And nearly half of the benefits will flow to filers earning over $200,000.
The Trump Budget's $1.2 Trillion in 'Phantom Revenues'

President Trump’s 2020 budget includes up to $1.2 trillion in “potentially phantom revenues” — money that comes from taxes the administration opposes or from tax hikes that face strong opposition from businesses, The Wall Street Journal’s Richard Rubin reports, citing data from the Committee for a Responsible Federal Budget. That total, covering 2020 through 2029, includes as much as $390 billion in taxes created under the Affordable Care Act, which the president wants to repeal.
The $1.2 trillion in questionable revenue projections is in addition to the White House budget’s projected deficits of $7.3 trillion for the 10-year period. That total is itself questionable, given that the president’s budget relies on optimistic assumptions about economic growth and some unrealistic spending cuts, meaning that the deficits could be significantly higher than projected.
Republicans Push Ahead on Medicaid Restrictions

The Trump administration on Friday approved Ohio’s request to impose work requirements on Medicaid recipients. Starting in 2021, the state will require most able-bodied adults aged 19 to 49 to either work, go to school, be in job training or volunteer for 80 hours a month in order to receive Medicaid benefits. Those who fail to meet the requirements over 60 days will be removed from the system, although they can reapply immediately.
The new work requirements include exemptions for pregnant women, caretakers and those living in counties with high unemployment rates and will apply only to those covered through the expansion of Medicaid under the Affordable Care Act. There are currently about 540,000 people on Medicaid in Ohio who receive coverage through the expansion, according to Kaitlin Schroeder of The Dayton Daily News, compared to roughly 2.6 million Medicaid recipients in the state overall.
Once implemented, the work requirements are expected to result in 36,000 people losing their Medicaid eligibility, according to state officials, though critics say the reductions could be significantly larger. Similar work requirements in Arkansas pushed 18,000 people off the Medicaid rolls in six months.
A larger GOP project: The creation of new work requirements is part of a larger effort by Republicans to limit the expansion of Medicaid, says The Wall Street Journal’s Stephanie Armour. Since the Affordable Care Act passed in 2010, 36 states have expanded their Medicaid programs under the ACA and the number of people in the program has grown by 50 percent, from roughly 50 million to about 75 million. But many red-state governors have expressed concerns about the cost of Medicaid expansion and worries about a lack of self-sufficiency among the able-bodied poor, and are embracing new limitations on the program for both fiscal and political reasons.
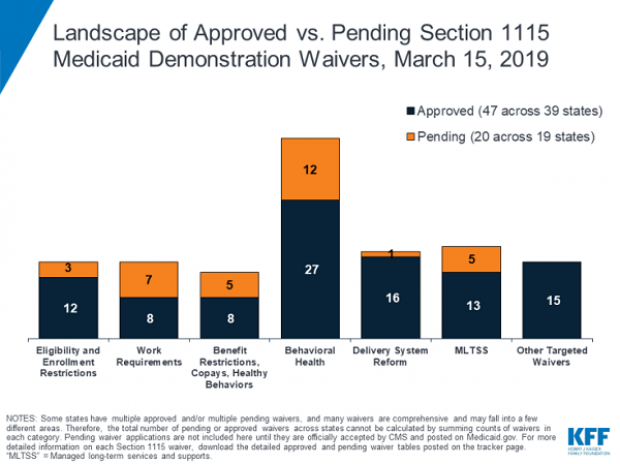
In 2017, the White House in 2017 gave states the green light to explore ways to limit the reach and expense of their Medicaid programs. Governors have proposed a variety of new rules, which require waivers from the federal government to enact. Kentucky, for example, wants to drug-test Medicaid recipients, and Utah wants a partial expansion and a cap on payments. Kaiser Health News summarizes the variety of waivers states have requested, which are governed by Section 1115 of the Social Security Act, in the chart below.
Legal challenges: Efforts to restrict Medicaid have received legal challenges, and U.S. District Judge James Boasberg blocked work requirements in Kentucky last year. The same judge, who has expressed doubts about the administration’s approach to Medicaid, will rule on the legality of work requirements in both Kentucky and Arkansas by April 1.
The bottom line: The Trump administration is seeking fundamental changes in how Medicaid works. Even if Boasberg rules against work requirements, expect the White House and Republican governors to continue to push for new limitations on the program.
Chart of the Day: Trump's Huge Proposed Cuts to Public Investment
Ben Ritz of the Progressive Policy Institute slams President Trump’s new budget:
“It would dismantle public investments that lay the foundation for economic growth, resulting in less innovation. It would shred the social safety net, resulting in more poverty. It would rip away access to affordable health care, resulting in more disease. It would cut taxes for the rich, resulting in more income inequality. It would bloat the defense budget, resulting in more wasteful spending. And all this would add up to a higher national debt than the policies in President Obama’s final budget proposal.”
Here’s Ritz’s breakdown of Trump’s proposed spending cuts to public investment in areas such as infrastructure, education and scientific research:
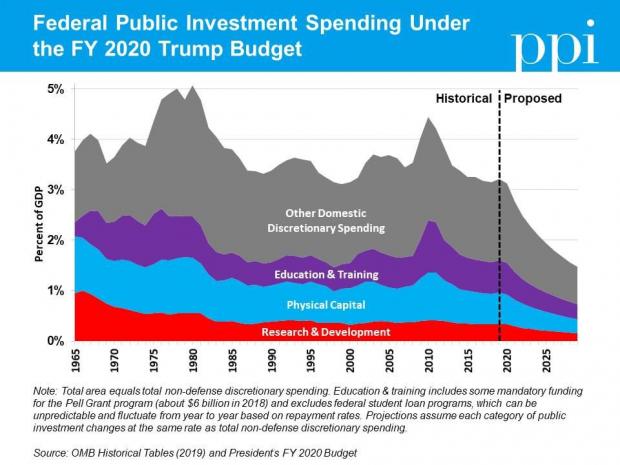
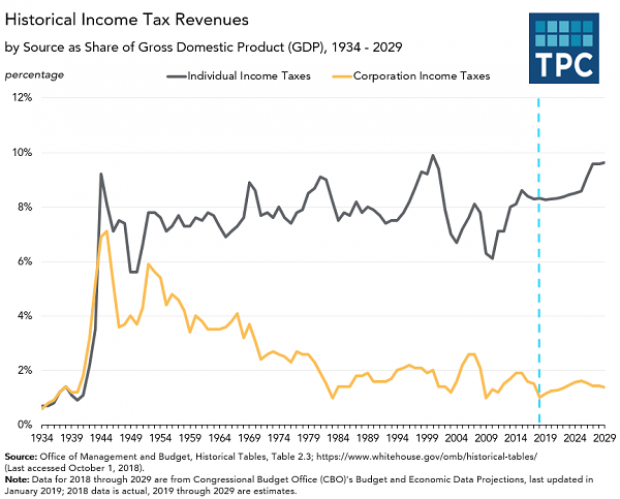
Chart of the Day: The Decline in Corporate Taxes

Since roughly the end of World War Two, individual income taxes in the U.S. have equaled about 8 percent of GDP. By contrast, the Tax Policy Center says, “corporate income tax revenues declined from 6% of GDP in 1950s to under 2% in the 1980s through the Great Recession, and have averaged 1.4% of GDP since then.”