Automakers Are Having a Record Year, but Here’s a Trend that Should Worry Them

U.S. auto sales closed out the summer on a positive note, topping estimates and casting some rosy light on the health of the American consumer. Recording its best August since 2003, the auto industry is on pace to sell 17.8 vehicles in 2015, well ahead of expectations of 17.3 million. If the numbers hold up, 2015 will be the best year ever for U.S. auto sales, beating the 17.4 million mark set in 2000.
The general consensus is that auto industry is in pretty good shape these days. Gas prices and interest rates are low, boosting the market for cars and light trucks. More than 2 million jobs were added to the U.S. economy in the past year, and more jobs is usually good news for auto sales. The unemployment rate has been trending lower for five years, sitting at a relatively healthy 5.3 percent in July.
Related: What's Next for Oil Prices? Look Out Below!
As with any statistic, though, there’s more than one way to look at the situation. Sure, auto sales are climbing as the economy gets stronger and more Americans hit their local car dealers’ lots. At least to some degree, though, higher auto sales should be expected just as a result of U.S. population growth. And those rising monthly sales figures are masking a continuing trend that is more worrisome for the auto industry: per capita auto sales are still in a long-term decline, even including the solid growth the industry has seen since the end of the recession. Doug Short at Advisor Perspectives did the math and made a graph:

According to Short’s analysis, the peak year for per capita auto sales in the U.S. was 1978. As the red line in the graph shows, the trend is negative since then.
In the graph, per capita auto sales in January, 1976, were defined as 100; the readings in the index since then are relative to that 1976 sales level. As you can see, the index moves higher until August of 1978, when per capita auto sales were up nearly 20 percent over 1976. Since then, per capita auto sales have fallen, reaching a low in 2009 that was nearly 50 percent lower than 1976. Since 2009, per capita auto sales have risen nicely, but are still more than 15 percent below peak.
What could explain the negative trend? Two factors come to mind. First, demographics. It has been widely reported that the millennial generation is less interested in owning cars for a variety of reasons, ranging from a weak economy to a cultural shift away from suburban life. However, the data on millennial car purchases is ambiguous; recently, millennials have started buying cars in volumes that look a lot like their elders. And even if millennials are less interested in buying cars, their preferences can’t explain a shift that began in the 1970s, before they were born.
Related: U.S. Companies Are Dying Faster Than Ever
The other factor that may explain the trend is income inequality. A study of car ownership by the Carnegie Foundation found that countries with higher income inequality have fewer cars per capita. The logic is simple: As more income is claimed by the wealthy, there’s less to go around for everyone else. And that means there’s less money for middle and lower income groups to buy and maintain automobiles, among other things.
Here’s a chart of the Gini index for the U.S. since 1947. (The Gini Index is a widely-used measure of income inequality. A higher Gini number means higher inequality.) Note that the Gini reading started climbing in the late ‘70s – the same time when per capita car ownership in the U.S. began to fall.
This chart tells us, not for the first time, that the U.S. has experienced more income inequality since the 1970s. Combined with the per capita auto sales data above, it suggests that as the rich have gotten richer and everyone else has struggled to keep up, car ownership has suffered. Although this is by no means proof of the relationship between income inequality and per capita car ownership over the last 40 years, it hints at an interesting theory – and suggests that the auto industry has good reason to be concerned about growing inequality in the U.S.

Top Reads From The Fiscal Times:
- 6 Reasons Gas Prices Could Fall Below $2 a Gallon
- Hoping for a Raise? Here’s How Much Most People Are Getting
- What the U.S. Must Do to Avoid Another Financial Crisis
Map of the Day: Navigating the IRS

The Taxpayer Advocate Service – an independent organization within the IRS whose roughly 1,800 employees both assist taxpayers in resolving problems with the tax collection agency and recommend changes aimed at improving the system – released a “subway map” that shows the “the stages of a taxpayer’s journey.” The colorful diagram includes the steps a typical taxpayer takes to prepare and file their tax forms, as well as the many “stations” a tax return can pass through, including processing, audits, appeals and litigation. Not surprisingly, the map is quite complicated. Click here to review a larger version on the taxpayer advocate’s site.

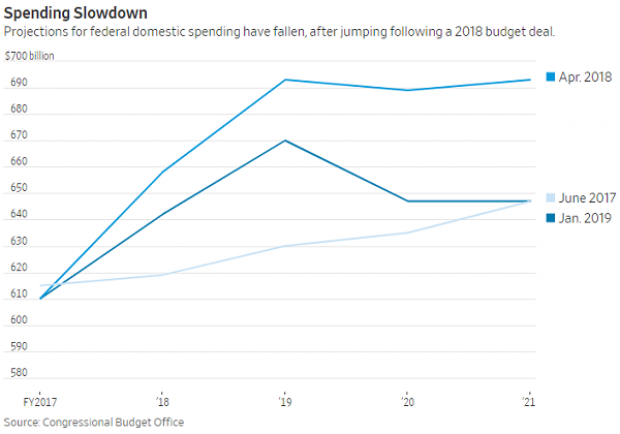
A Surprise Government Spending Slowdown
")
Economists expected federal spending to boost growth in 2019, but some of the fiscal stimulus provided by the 2018 budget deal has failed to show up this year, according to Kate Davidson of The Wall Street Journal.
Defense spending has come in as expected, but nondefense spending has lagged, and it’s unlikely to catch up to projections even if it accelerates in the coming months. Lower spending on disaster relief, the government shutdown earlier this year, and federal agencies spending less than they have been given by Congress all appear to be playing a role in the spending slowdown, Davidson said.
Number of the Day: $203,500

The Wall Street Journal’s Catherine Lucey reports that acting White House Chief of Staff Mick Mulvaney is making a bit more than his predecessors: “The latest annual report to Congress on White House personnel shows that President Trump’s third chief of staff is getting an annual salary of $203,500, compared with Reince Priebus and John Kelly, each of whom earned $179,700.” The difference is the result of Mulvaney still technically occupying the role of director of the White House Office of Management and Budget, where his salary level is set by law.
The White House told the Journal that if Mulvaney is made permanent chief of staff his salary would be adjusted to the current salary for an assistant to the president, $183,000.
The Census Affects Nearly $1 Trillion in Spending

The 2020 census faces possible delay as the Supreme Court sorts out the legality of a controversial citizenship question added by the Trump administration. Tracy Gordon of the Tax Policy Center notes that in addition to the basic issue of political representation, the decennial population count affects roughly $900 billion in federal spending, ranging from Medicaid assistance funds to Section 8 housing vouchers. Here’s a look at the top 10 programs affected by the census:
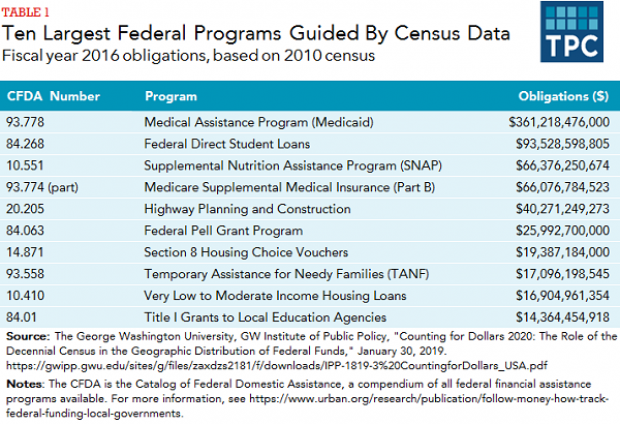
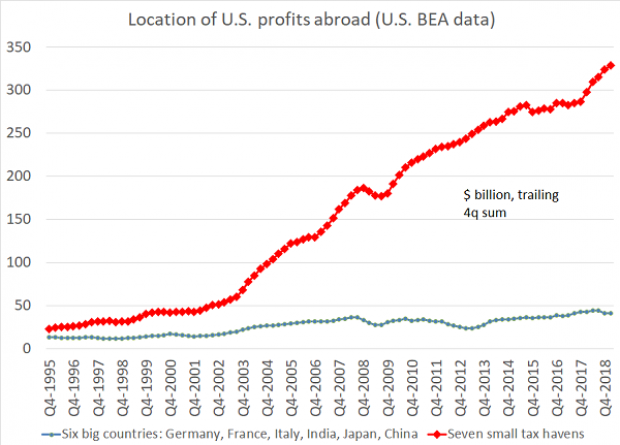
Chart of the Day: Offshore Profits Continue to Rise

Brad Setser, a former U.S. Treasury economist now with the Council on Foreign Relations, added another detail to his assessment of the foreign provisions of the Tax Cuts and Jobs Act: “A bit more evidence that Trump's tax reform didn't change incentives to offshore profits: the enormous profits that U.S. firms report in low tax jurisdictions continues to rise,” Setser wrote. “In fact, there was a bit of a jump up over the course of 2018.”