Automakers Are Having a Record Year, but Here’s a Trend that Should Worry Them

U.S. auto sales closed out the summer on a positive note, topping estimates and casting some rosy light on the health of the American consumer. Recording its best August since 2003, the auto industry is on pace to sell 17.8 vehicles in 2015, well ahead of expectations of 17.3 million. If the numbers hold up, 2015 will be the best year ever for U.S. auto sales, beating the 17.4 million mark set in 2000.
The general consensus is that auto industry is in pretty good shape these days. Gas prices and interest rates are low, boosting the market for cars and light trucks. More than 2 million jobs were added to the U.S. economy in the past year, and more jobs is usually good news for auto sales. The unemployment rate has been trending lower for five years, sitting at a relatively healthy 5.3 percent in July.
Related: What's Next for Oil Prices? Look Out Below!
As with any statistic, though, there’s more than one way to look at the situation. Sure, auto sales are climbing as the economy gets stronger and more Americans hit their local car dealers’ lots. At least to some degree, though, higher auto sales should be expected just as a result of U.S. population growth. And those rising monthly sales figures are masking a continuing trend that is more worrisome for the auto industry: per capita auto sales are still in a long-term decline, even including the solid growth the industry has seen since the end of the recession. Doug Short at Advisor Perspectives did the math and made a graph:

According to Short’s analysis, the peak year for per capita auto sales in the U.S. was 1978. As the red line in the graph shows, the trend is negative since then.
In the graph, per capita auto sales in January, 1976, were defined as 100; the readings in the index since then are relative to that 1976 sales level. As you can see, the index moves higher until August of 1978, when per capita auto sales were up nearly 20 percent over 1976. Since then, per capita auto sales have fallen, reaching a low in 2009 that was nearly 50 percent lower than 1976. Since 2009, per capita auto sales have risen nicely, but are still more than 15 percent below peak.
What could explain the negative trend? Two factors come to mind. First, demographics. It has been widely reported that the millennial generation is less interested in owning cars for a variety of reasons, ranging from a weak economy to a cultural shift away from suburban life. However, the data on millennial car purchases is ambiguous; recently, millennials have started buying cars in volumes that look a lot like their elders. And even if millennials are less interested in buying cars, their preferences can’t explain a shift that began in the 1970s, before they were born.
Related: U.S. Companies Are Dying Faster Than Ever
The other factor that may explain the trend is income inequality. A study of car ownership by the Carnegie Foundation found that countries with higher income inequality have fewer cars per capita. The logic is simple: As more income is claimed by the wealthy, there’s less to go around for everyone else. And that means there’s less money for middle and lower income groups to buy and maintain automobiles, among other things.
Here’s a chart of the Gini index for the U.S. since 1947. (The Gini Index is a widely-used measure of income inequality. A higher Gini number means higher inequality.) Note that the Gini reading started climbing in the late ‘70s – the same time when per capita car ownership in the U.S. began to fall.
This chart tells us, not for the first time, that the U.S. has experienced more income inequality since the 1970s. Combined with the per capita auto sales data above, it suggests that as the rich have gotten richer and everyone else has struggled to keep up, car ownership has suffered. Although this is by no means proof of the relationship between income inequality and per capita car ownership over the last 40 years, it hints at an interesting theory – and suggests that the auto industry has good reason to be concerned about growing inequality in the U.S.

Top Reads From The Fiscal Times:
- 6 Reasons Gas Prices Could Fall Below $2 a Gallon
- Hoping for a Raise? Here’s How Much Most People Are Getting
- What the U.S. Must Do to Avoid Another Financial Crisis
Deficit Hits $738.6 Billion in First 8 Months of Fiscal Year
The U.S. budget deficit grew to $738.6 billion in the first eight months of the current fiscal year – an increase of $206 billion, or 38.8%, over the deficit recorded during the same period a year earlier. Bloomberg’s Sarah McGregor notes that the big increase occurred despite a jump in tariff revenues, which have nearly doubled to $44.9 billion so far this fiscal year. But that increase, which contributed to an overall increase in revenues of 2.3%, was not enough to make up for the reduced revenues from the Republican tax cuts and a 9.3% increase in government spending.
Tweet of the Day: Revenues or Spending?

Rep. Kevin Brady (R-TX), ranking member of the House Ways and Means Committee and one of the authors of the 2017 Republican tax overhaul, told The Washington Post’s Heather Long Tuesday that the budget deficit is driven by excess spending, not a shortfall in revenues in the wake of the tax cuts. The Wall Street Journal’s Kate Davidson provided some inconvenient facts for Brady’s claim in a tweet, pointing out that government revenues as a share of GDP have fallen significantly since 2015, while spending has remained more or less constant.
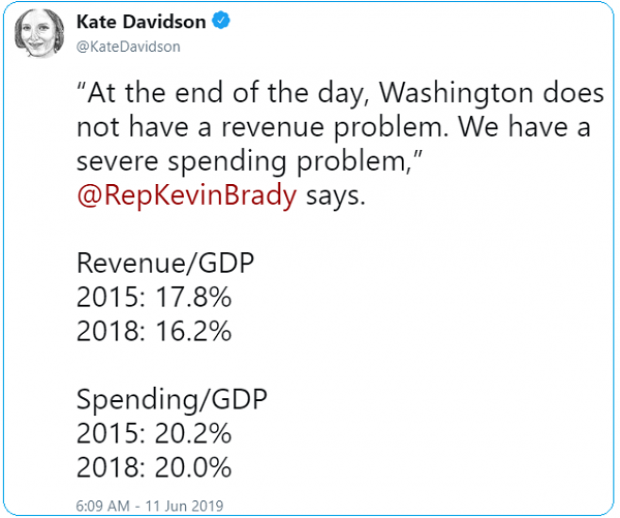
Chart of the Day: The Decline in IRS Audits

Reviewing the recent annual report on tax statistics from the IRS, Robert Weinberger of the Tax Policy Center says it “tells a story of shrinking staff, fewer audits, and less customer service.” The agency had 22% fewer personnel in 2018 than it did in 2010, and its enforcement budget has fallen by nearly $1 billion, Weinberger writes. One obvious effect of the budget cuts has been a sharp reduction in the number of audits the agency has performed annually, which you can see in the chart below.

Number of the Day: $102 Million

President Trump’s golf playing has cost taxpayers $102 million in extra travel and security expenses, according to an analysis by the left-leaning HuffPost news site.
“The $102 million total to date spent on Trump’s presidential golfing represents 255 times the annual presidential salary he volunteered not to take. It is more than three times the cost of special counsel Robert Mueller’s investigation that Trump continually complains about. It would fund for six years the Special Olympics program that Trump’s proposed budget had originally cut to save money,” HuffPost’s S.V. Date writes.
Date says the White House did not respond to HuffPost’s requests for comment.
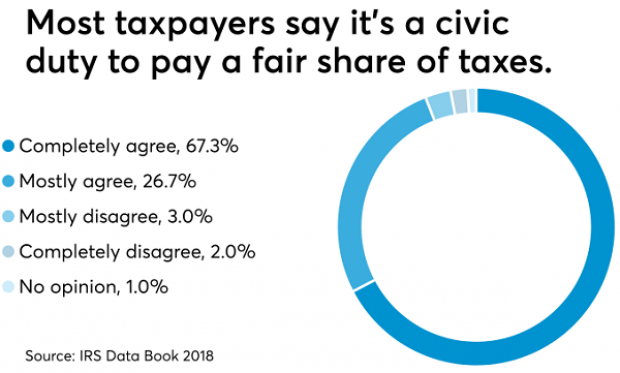
Americans See Tax-Paying as a Duty

The IRS may not be conducting audits like it used to, but according to the agency’s Data Book for 2018, most Americans still believe it’s not acceptable to cheat on your taxes. About 67% of respondents to an IRS opinion survey “completely agree” that it’s a civic duty to pay “a fair share of taxes,” and another 26% “mostly agree,” bringing the total in agreement to over 90%. Accounting Today says that attitude has been pretty consistent over the last decade.