Automakers Are Having a Record Year, but Here’s a Trend that Should Worry Them

U.S. auto sales closed out the summer on a positive note, topping estimates and casting some rosy light on the health of the American consumer. Recording its best August since 2003, the auto industry is on pace to sell 17.8 vehicles in 2015, well ahead of expectations of 17.3 million. If the numbers hold up, 2015 will be the best year ever for U.S. auto sales, beating the 17.4 million mark set in 2000.
The general consensus is that auto industry is in pretty good shape these days. Gas prices and interest rates are low, boosting the market for cars and light trucks. More than 2 million jobs were added to the U.S. economy in the past year, and more jobs is usually good news for auto sales. The unemployment rate has been trending lower for five years, sitting at a relatively healthy 5.3 percent in July.
Related: What's Next for Oil Prices? Look Out Below!
As with any statistic, though, there’s more than one way to look at the situation. Sure, auto sales are climbing as the economy gets stronger and more Americans hit their local car dealers’ lots. At least to some degree, though, higher auto sales should be expected just as a result of U.S. population growth. And those rising monthly sales figures are masking a continuing trend that is more worrisome for the auto industry: per capita auto sales are still in a long-term decline, even including the solid growth the industry has seen since the end of the recession. Doug Short at Advisor Perspectives did the math and made a graph:

According to Short’s analysis, the peak year for per capita auto sales in the U.S. was 1978. As the red line in the graph shows, the trend is negative since then.
In the graph, per capita auto sales in January, 1976, were defined as 100; the readings in the index since then are relative to that 1976 sales level. As you can see, the index moves higher until August of 1978, when per capita auto sales were up nearly 20 percent over 1976. Since then, per capita auto sales have fallen, reaching a low in 2009 that was nearly 50 percent lower than 1976. Since 2009, per capita auto sales have risen nicely, but are still more than 15 percent below peak.
What could explain the negative trend? Two factors come to mind. First, demographics. It has been widely reported that the millennial generation is less interested in owning cars for a variety of reasons, ranging from a weak economy to a cultural shift away from suburban life. However, the data on millennial car purchases is ambiguous; recently, millennials have started buying cars in volumes that look a lot like their elders. And even if millennials are less interested in buying cars, their preferences can’t explain a shift that began in the 1970s, before they were born.
Related: U.S. Companies Are Dying Faster Than Ever
The other factor that may explain the trend is income inequality. A study of car ownership by the Carnegie Foundation found that countries with higher income inequality have fewer cars per capita. The logic is simple: As more income is claimed by the wealthy, there’s less to go around for everyone else. And that means there’s less money for middle and lower income groups to buy and maintain automobiles, among other things.
Here’s a chart of the Gini index for the U.S. since 1947. (The Gini Index is a widely-used measure of income inequality. A higher Gini number means higher inequality.) Note that the Gini reading started climbing in the late ‘70s – the same time when per capita car ownership in the U.S. began to fall.
This chart tells us, not for the first time, that the U.S. has experienced more income inequality since the 1970s. Combined with the per capita auto sales data above, it suggests that as the rich have gotten richer and everyone else has struggled to keep up, car ownership has suffered. Although this is by no means proof of the relationship between income inequality and per capita car ownership over the last 40 years, it hints at an interesting theory – and suggests that the auto industry has good reason to be concerned about growing inequality in the U.S.

Top Reads From The Fiscal Times:
- 6 Reasons Gas Prices Could Fall Below $2 a Gallon
- Hoping for a Raise? Here’s How Much Most People Are Getting
- What the U.S. Must Do to Avoid Another Financial Crisis
Chart of the Day: Why US Fertility Rates Are Falling
 Babysit")
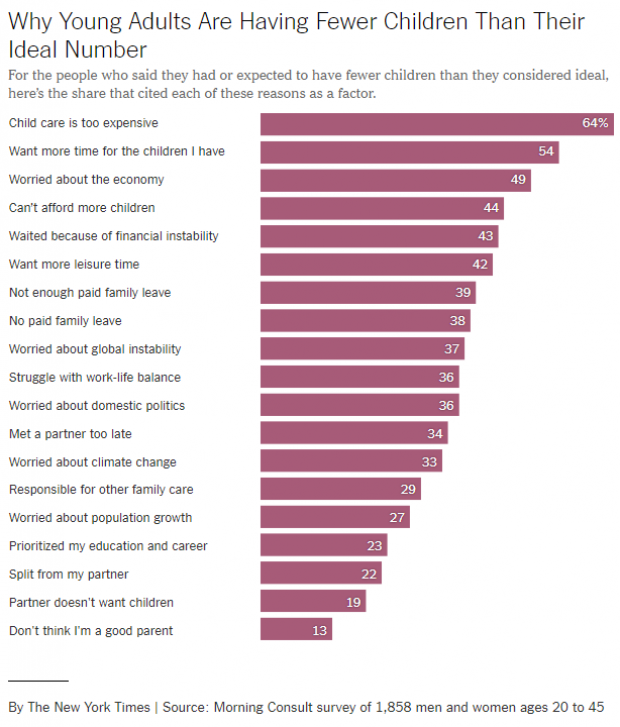
U.S. fertility rates have fallen to record lows for two straight years. “Because the fertility rate subtly shapes many major issues of the day — including immigration, education, housing, the labor supply, the social safety net and support for working families — there’s a lot of concern about why today’s young adults aren’t having as many children,” Claire Cain Miller explains at The New York Times’ Upshot. “So we asked them.”
Here are some results of the Times’ survey, conducted with Morning Consult. Read the full Times story for more details.
A Record Low 47% of US Adults Say They're 'Extremely Proud' to Be American
Gallup says that, for the first time in the 18 years it’s been asking U.S. adults how proud they are to be Americans, fewer than half say they are "extremely proud." Just 47 percent now say they’re extremely proud, down from 70 percent in 2003.
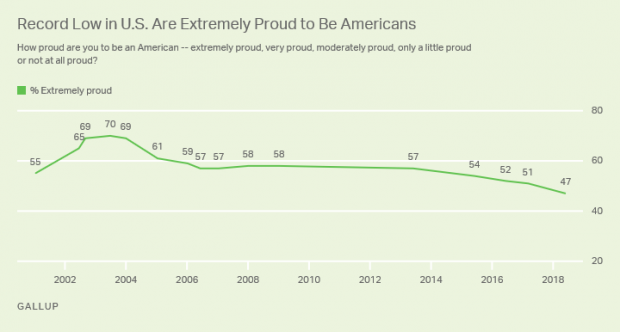
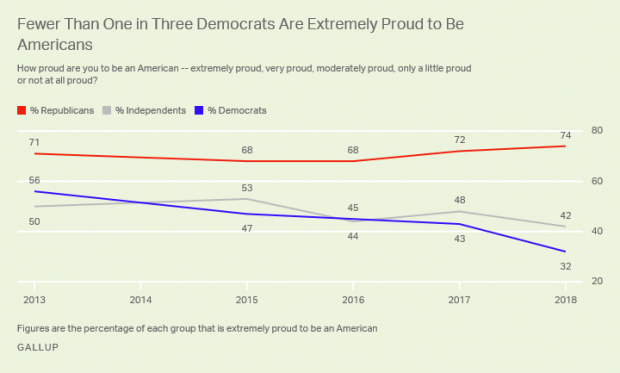
Another 25 percent say they’re “very proud” — but the combined 72 percent who say they’re extremely or very proud is also the lowest Gallup has recorded. Pride levels among liberals and Democrats have plunged since 2017. Overall, 74 percent of Republicans and just 32 percent of Democrats call themselves “extremely proud” to be American.
Pfizer Has Raised Prices on 100 of Its Products

Weeks after President Trump said that drugmakers were about to implement “voluntary massive drops in prices” — reductions that have yet to materialize — Pfizer has raised prices on 100 of its products, The Financial Times’s David Crow reports:
“The increases were effective as of July 1 and in most cases were more than 9 per cent — well above the rate of inflation in the US, which is running at about 2 per cent. … Pfizer, the largest standalone drugmaker in the US, did decrease the prices of five products by between 16 per cent and 44 per cent, according to the figures.”
Crow notes that Pfizer also raised prices on many of its medicines in January, meaning that some prices have been hiked by nearly 20 percent this year. The drugmaker said that it was only changing prices on 10 percent of its medicines and that list prices did not reflect what most patients or insurers actually paid. The net price increase after rebates and discounts was expected to be in the “low single digits,” the company told the FT.
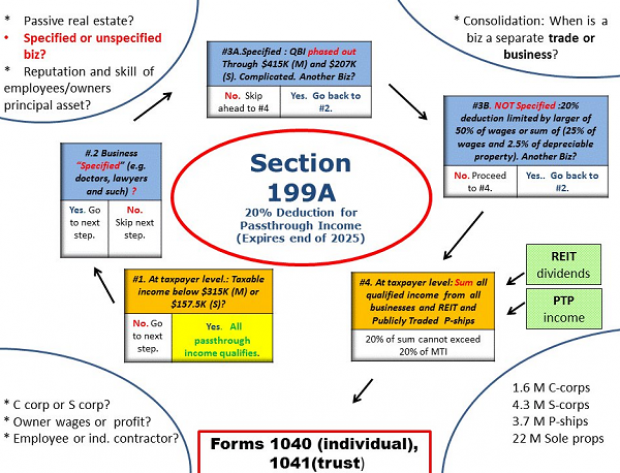
Chart of the Day: Pass-Through Tax Deductions Made Easy

The Republican tax overhaul was supposed to simplify the tax code, but most experts say it fell well short of the goal. Martin Sullivan, chief economist at Tax Analysts, tweeted out a chart of the analysis required to determine whether income qualifies for the passthrough tax deduction of 20 percent, and as you’ll see, it’s anything but simple.
A Conservative Bashes GOP Dysfunction on Spending Cuts

Brian Riedl, a senior fellow at the conservative Manhattan Institute, offers a blistering critique of congressional Republican’s problems cutting spending:
Since the Republicans took the House in 2011, nearly every annual budget blueprint has promised to balance the budget within a decade with anywhere from $5 trillion to $8 trillion in spending cuts. And yet, you may have noticed, the budget has not moved towards balance. This is because the budget merely sets a broad fiscal goal. To actually cut spending, Congress must follow up with specific legislation to reform Medicare, Medicaid, and all the other targeted programs. In reality, most lawmakers who pass these budgets have no intention whatsoever of cutting this spending. As soon as the budget is passed, the targets are forgotten. The spending-cut legislation is never even drafted, much less voted on.
The annual budget exercise is thus a cynical exercise in symbolism. Congress calculates how much spending must be cut over ten years to balance the budget. Then they pass legislation setting a goal of cutting that amount. Then they move on to other business. It’s like a baseball team announcing that they voted to win the next World Series, and then not showing up to play the season.
Read the full piece at National Review.