Automakers Are Having a Record Year, but Here’s a Trend that Should Worry Them

U.S. auto sales closed out the summer on a positive note, topping estimates and casting some rosy light on the health of the American consumer. Recording its best August since 2003, the auto industry is on pace to sell 17.8 vehicles in 2015, well ahead of expectations of 17.3 million. If the numbers hold up, 2015 will be the best year ever for U.S. auto sales, beating the 17.4 million mark set in 2000.
The general consensus is that auto industry is in pretty good shape these days. Gas prices and interest rates are low, boosting the market for cars and light trucks. More than 2 million jobs were added to the U.S. economy in the past year, and more jobs is usually good news for auto sales. The unemployment rate has been trending lower for five years, sitting at a relatively healthy 5.3 percent in July.
Related: What's Next for Oil Prices? Look Out Below!
As with any statistic, though, there’s more than one way to look at the situation. Sure, auto sales are climbing as the economy gets stronger and more Americans hit their local car dealers’ lots. At least to some degree, though, higher auto sales should be expected just as a result of U.S. population growth. And those rising monthly sales figures are masking a continuing trend that is more worrisome for the auto industry: per capita auto sales are still in a long-term decline, even including the solid growth the industry has seen since the end of the recession. Doug Short at Advisor Perspectives did the math and made a graph:

According to Short’s analysis, the peak year for per capita auto sales in the U.S. was 1978. As the red line in the graph shows, the trend is negative since then.
In the graph, per capita auto sales in January, 1976, were defined as 100; the readings in the index since then are relative to that 1976 sales level. As you can see, the index moves higher until August of 1978, when per capita auto sales were up nearly 20 percent over 1976. Since then, per capita auto sales have fallen, reaching a low in 2009 that was nearly 50 percent lower than 1976. Since 2009, per capita auto sales have risen nicely, but are still more than 15 percent below peak.
What could explain the negative trend? Two factors come to mind. First, demographics. It has been widely reported that the millennial generation is less interested in owning cars for a variety of reasons, ranging from a weak economy to a cultural shift away from suburban life. However, the data on millennial car purchases is ambiguous; recently, millennials have started buying cars in volumes that look a lot like their elders. And even if millennials are less interested in buying cars, their preferences can’t explain a shift that began in the 1970s, before they were born.
Related: U.S. Companies Are Dying Faster Than Ever
The other factor that may explain the trend is income inequality. A study of car ownership by the Carnegie Foundation found that countries with higher income inequality have fewer cars per capita. The logic is simple: As more income is claimed by the wealthy, there’s less to go around for everyone else. And that means there’s less money for middle and lower income groups to buy and maintain automobiles, among other things.
Here’s a chart of the Gini index for the U.S. since 1947. (The Gini Index is a widely-used measure of income inequality. A higher Gini number means higher inequality.) Note that the Gini reading started climbing in the late ‘70s – the same time when per capita car ownership in the U.S. began to fall.
This chart tells us, not for the first time, that the U.S. has experienced more income inequality since the 1970s. Combined with the per capita auto sales data above, it suggests that as the rich have gotten richer and everyone else has struggled to keep up, car ownership has suffered. Although this is by no means proof of the relationship between income inequality and per capita car ownership over the last 40 years, it hints at an interesting theory – and suggests that the auto industry has good reason to be concerned about growing inequality in the U.S.

Top Reads From The Fiscal Times:
- 6 Reasons Gas Prices Could Fall Below $2 a Gallon
- Hoping for a Raise? Here’s How Much Most People Are Getting
- What the U.S. Must Do to Avoid Another Financial Crisis
GOP Tax Cuts Getting Less Popular, Poll Finds
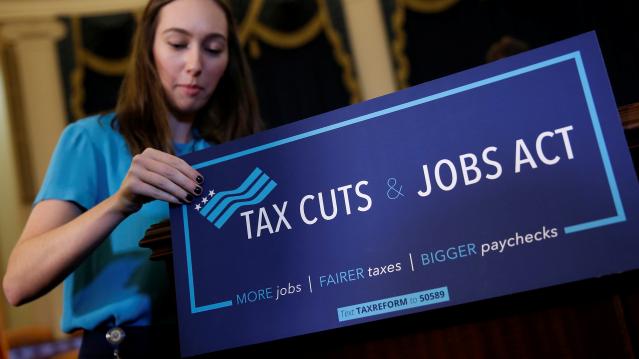
Friday marked the six-month anniversary of President Trump’s signing the Republican tax overhaul into law, and public opinion of the law is moving in the wrong direction for the GOP. A Monmouth University survey conducted earlier this month found that 34 percent of the public approves of the tax reform passed by Republicans late last year, while 41 percent disapprove. Approval has fallen by 6 points since late April and disapproval has slipped 3 points. The percentage of people who aren’t sure how they feel about the plan has risen from 16 percent in April to 24 percent this month.
Other findings from the poll of 806 U.S. adults:
- 19 percent approve of the job Congress is doing; 67 percent disapprove
- 40 percent say the country is heading in the right direction, up from 33 percent in April
- Democrats hold a 7-point edge in a generic House ballot
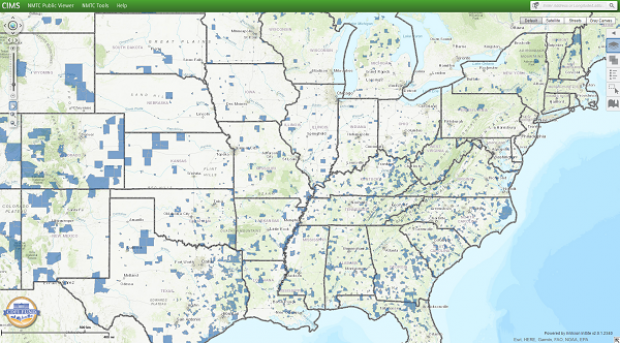
Special Tax Break Zones Defined for All 50 States

The U.S. Treasury has approved the final group of opportunity zones, which offer tax incentives for investments made in low-income areas. The zones were created by the tax law signed in December.
Bill Lucia of Route Fifty has some details: “Treasury says that nearly 35 million people live in the designated zones and that census tracts in the zones have an average poverty rate of about 32 percent based on figures from 2011 to 2015, compared to a rate of 17 percent for the average U.S. census tract.”
Click here to explore the dynamic map of the zones on the U.S. Treasury website.
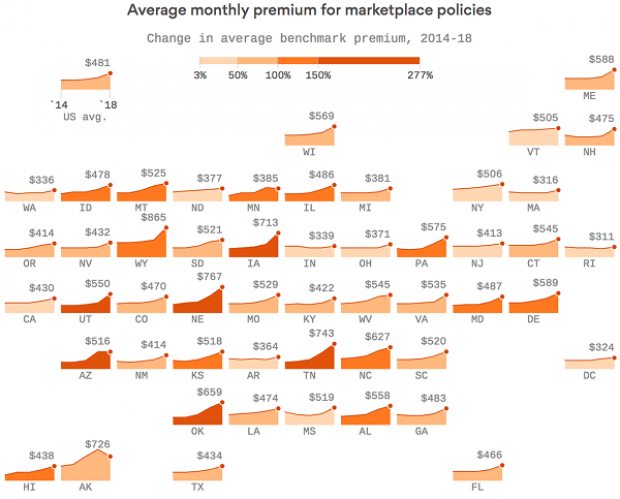
Map of the Day: Affordable Care Act Premiums Since 2014
Axios breaks down how monthly premiums on benchmark Affordable Care Act policies have risen state by state since 2014. The average increase: $481.
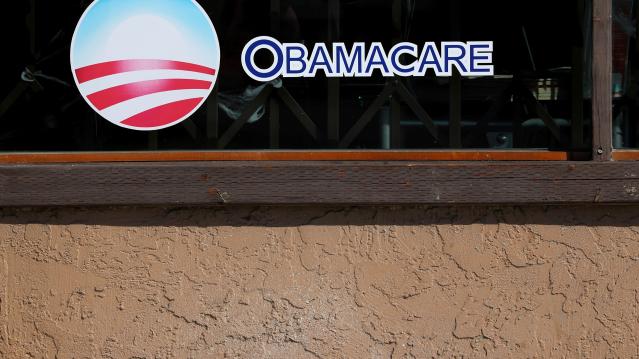
Obamacare Repeal Would Lead to 17.1 Million More Uninsured in 2019: Study

A new analysis by the Urban Institute finds that if the Affordable Care Act were eliminated entirely, the number of uninsured would rise by 17.1 million — or 50 percent — in 2019. The study also found that federal spending would be reduced by almost $147 billion next year if the ACA were fully repealed.
Your Tax Dollars at Work
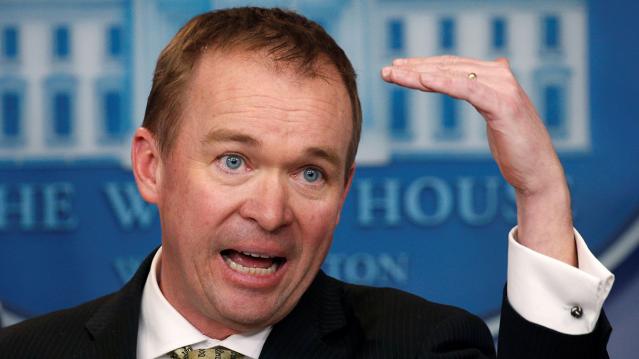
Mick Mulvaney has been running the Consumer Financial Protection Bureau since last November, and by all accounts the South Carolina conservative is none too happy with the agency charged with protecting citizens from fraud in the financial industry. The Hill recently wrote up “five ways Mulvaney is cracking down on his own agency,” and they include dropping cases against payday lenders, dismissing three advisory boards and an effort to rebrand the operation as the Bureau of Consumer Financial Protection — a move critics say is intended to deemphasize the consumer part of the agency’s mission.
Mulvaney recently scored a small victory on the last point, changing the sign in the agency’s building to the new initials. “The Consumer Financial Protection Bureau does not exist,” Mulvaney told Congress in April, and now he’s proven the point, at least when it comes to the sign in his lobby (h/t to Vox and thanks to Alan Zibel of Public Citizen for the photo, via Twitter).