Automakers Are Having a Record Year, but Here’s a Trend that Should Worry Them

U.S. auto sales closed out the summer on a positive note, topping estimates and casting some rosy light on the health of the American consumer. Recording its best August since 2003, the auto industry is on pace to sell 17.8 vehicles in 2015, well ahead of expectations of 17.3 million. If the numbers hold up, 2015 will be the best year ever for U.S. auto sales, beating the 17.4 million mark set in 2000.
The general consensus is that auto industry is in pretty good shape these days. Gas prices and interest rates are low, boosting the market for cars and light trucks. More than 2 million jobs were added to the U.S. economy in the past year, and more jobs is usually good news for auto sales. The unemployment rate has been trending lower for five years, sitting at a relatively healthy 5.3 percent in July.
Related: What's Next for Oil Prices? Look Out Below!
As with any statistic, though, there’s more than one way to look at the situation. Sure, auto sales are climbing as the economy gets stronger and more Americans hit their local car dealers’ lots. At least to some degree, though, higher auto sales should be expected just as a result of U.S. population growth. And those rising monthly sales figures are masking a continuing trend that is more worrisome for the auto industry: per capita auto sales are still in a long-term decline, even including the solid growth the industry has seen since the end of the recession. Doug Short at Advisor Perspectives did the math and made a graph:

According to Short’s analysis, the peak year for per capita auto sales in the U.S. was 1978. As the red line in the graph shows, the trend is negative since then.
In the graph, per capita auto sales in January, 1976, were defined as 100; the readings in the index since then are relative to that 1976 sales level. As you can see, the index moves higher until August of 1978, when per capita auto sales were up nearly 20 percent over 1976. Since then, per capita auto sales have fallen, reaching a low in 2009 that was nearly 50 percent lower than 1976. Since 2009, per capita auto sales have risen nicely, but are still more than 15 percent below peak.
What could explain the negative trend? Two factors come to mind. First, demographics. It has been widely reported that the millennial generation is less interested in owning cars for a variety of reasons, ranging from a weak economy to a cultural shift away from suburban life. However, the data on millennial car purchases is ambiguous; recently, millennials have started buying cars in volumes that look a lot like their elders. And even if millennials are less interested in buying cars, their preferences can’t explain a shift that began in the 1970s, before they were born.
Related: U.S. Companies Are Dying Faster Than Ever
The other factor that may explain the trend is income inequality. A study of car ownership by the Carnegie Foundation found that countries with higher income inequality have fewer cars per capita. The logic is simple: As more income is claimed by the wealthy, there’s less to go around for everyone else. And that means there’s less money for middle and lower income groups to buy and maintain automobiles, among other things.
Here’s a chart of the Gini index for the U.S. since 1947. (The Gini Index is a widely-used measure of income inequality. A higher Gini number means higher inequality.) Note that the Gini reading started climbing in the late ‘70s – the same time when per capita car ownership in the U.S. began to fall.
This chart tells us, not for the first time, that the U.S. has experienced more income inequality since the 1970s. Combined with the per capita auto sales data above, it suggests that as the rich have gotten richer and everyone else has struggled to keep up, car ownership has suffered. Although this is by no means proof of the relationship between income inequality and per capita car ownership over the last 40 years, it hints at an interesting theory – and suggests that the auto industry has good reason to be concerned about growing inequality in the U.S.

Top Reads From The Fiscal Times:
- 6 Reasons Gas Prices Could Fall Below $2 a Gallon
- Hoping for a Raise? Here’s How Much Most People Are Getting
- What the U.S. Must Do to Avoid Another Financial Crisis
Economists See More Growth Ahead

Most business economists in the U.S. expect the economy to keep chugging along over the next three months, with rising corporate sales driving additional hiring and wage increases for workers.
The tax cuts, however, don’t seem to be playing a role in hiring and investment plans. And the trade conflicts stirred up by the Trump administration are having a negative influence, with the majority of economists at goods-producing firms who replied to the most recent survey by the National Association for Business Economics saying that their companies were putting investments on hold as they wait to see how things play out.
New Tax on Non-Profits Hits Public Universities

The Republican tax bill signed into law late last year imposed a 21 percent tax on employees at non-profits who earn more than $1 million a year. According to data from the Chronicle of Higher Education cited by Bloomberg, there were 12 presidents of public universities who received compensation of at least $1 million in 2017, with James Ramsey of the University of Louisville topping the list at $4.3 million. Endowment managers could also get hit with the tax, as could football coaches, some of whom earn substantially more than the presidents of their institutions.
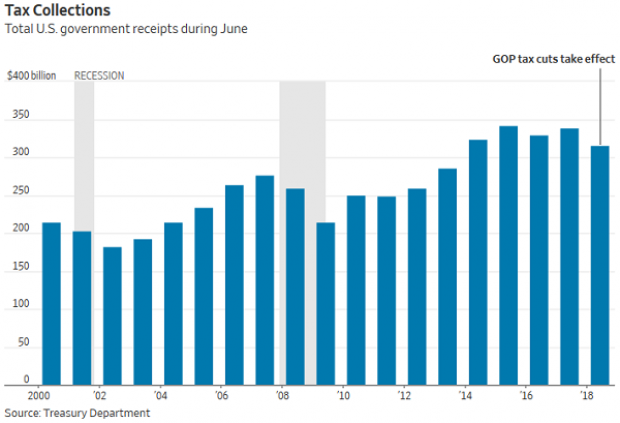
Government Revenues Drop as Tax Cuts Kick In

Corporate tax receipts in June were 33 percent lower than a year ago, according to data released by the Treasury Department Thursday, as companies made smaller estimated payments due to the reduction in their tax rates. Total receipts were down 7 percent, while payroll taxes were 5 percent lower compared to June 2017.
“June receipts to US government were our first mostly-clear look at the revenue effects of the new tax law, with lots of estimated payments and little noise from the 2017 tax year,” The Wall Street Journal’s Richard Rubin tweeted Friday.
Surprisingly, the deficit was smaller in June compared to a year ago, narrowing to $74.86 billion from $90.23 billion last year. The drop was driven by a 9 percent reduction in government outlays that reflected accounting changes rather than any real changes in spending, Rubin said in the Journal.
“More broadly, the federal deficit is swelling as government spending outpaces revenues,” Rubin wrote. “The budget gap totaled $607.1 billion in the first nine months of the 2018 fiscal year, 16% larger than the same point a year earlier.”
Kyle Pomerleau of the Tax Foundation pointed out that the drop in corporate tax receipts is a permanent feature of the Republican tax cuts, tweeting: “Even in a Trump dream world in which these cuts paid for themselves, corporate tax collections would remain below baseline forever. It would be higher income and payroll receipts that made up the difference.”
Deficit Jumps in Trump’s First Fiscal Year

The federal budget deficit rose by 16 percent in the first nine months of the 2018 fiscal year, which began last October. The shortfall came to $607 billion, compared to $523 billion in the same period the year before, according to a U.S. Treasury report released Thursday and reported by Bloomberg. Both revenue and spending rose, but spending rose faster. Revenues came to $2.54 trillion, up 1.3 percent from the same nine-month period in 2017, while spending came to $3.15 trillion, up 3.9 percent.
Where’s the Obamacare Navigator Funding for 2019, PA Insurance Commissioner Asks
Pennsylvania’s insurance commissioner sent a letter this week to Health and Human Services Secretary Alex Azar and Centers for Medicare and Medicaid Services (CMS) Administrator Seema Verma requesting that they “immediately release the funding details for the Navigator program for the upcoming open enrollment period for 2019.” Navigators are the state and local groups that help people sign up for Affordable Care Act plans.
“In years past, grant applications and new funding opportunities were released by CMS in April, CMS required Navigator organizations to apply by June and approved applications and new funding by late August,” Pennsylvania’s Jessica Altman wrote. “The current lack of guidance has put Navigator organizations – and states - far behind in their planning and creates an inability for the Navigator organizations to design a successful plan for helping people enroll during the 2019 open enrollment period.”