Automakers Are Having a Record Year, but Here’s a Trend that Should Worry Them

U.S. auto sales closed out the summer on a positive note, topping estimates and casting some rosy light on the health of the American consumer. Recording its best August since 2003, the auto industry is on pace to sell 17.8 vehicles in 2015, well ahead of expectations of 17.3 million. If the numbers hold up, 2015 will be the best year ever for U.S. auto sales, beating the 17.4 million mark set in 2000.
The general consensus is that auto industry is in pretty good shape these days. Gas prices and interest rates are low, boosting the market for cars and light trucks. More than 2 million jobs were added to the U.S. economy in the past year, and more jobs is usually good news for auto sales. The unemployment rate has been trending lower for five years, sitting at a relatively healthy 5.3 percent in July.
Related: What's Next for Oil Prices? Look Out Below!
As with any statistic, though, there’s more than one way to look at the situation. Sure, auto sales are climbing as the economy gets stronger and more Americans hit their local car dealers’ lots. At least to some degree, though, higher auto sales should be expected just as a result of U.S. population growth. And those rising monthly sales figures are masking a continuing trend that is more worrisome for the auto industry: per capita auto sales are still in a long-term decline, even including the solid growth the industry has seen since the end of the recession. Doug Short at Advisor Perspectives did the math and made a graph:

According to Short’s analysis, the peak year for per capita auto sales in the U.S. was 1978. As the red line in the graph shows, the trend is negative since then.
In the graph, per capita auto sales in January, 1976, were defined as 100; the readings in the index since then are relative to that 1976 sales level. As you can see, the index moves higher until August of 1978, when per capita auto sales were up nearly 20 percent over 1976. Since then, per capita auto sales have fallen, reaching a low in 2009 that was nearly 50 percent lower than 1976. Since 2009, per capita auto sales have risen nicely, but are still more than 15 percent below peak.
What could explain the negative trend? Two factors come to mind. First, demographics. It has been widely reported that the millennial generation is less interested in owning cars for a variety of reasons, ranging from a weak economy to a cultural shift away from suburban life. However, the data on millennial car purchases is ambiguous; recently, millennials have started buying cars in volumes that look a lot like their elders. And even if millennials are less interested in buying cars, their preferences can’t explain a shift that began in the 1970s, before they were born.
Related: U.S. Companies Are Dying Faster Than Ever
The other factor that may explain the trend is income inequality. A study of car ownership by the Carnegie Foundation found that countries with higher income inequality have fewer cars per capita. The logic is simple: As more income is claimed by the wealthy, there’s less to go around for everyone else. And that means there’s less money for middle and lower income groups to buy and maintain automobiles, among other things.
Here’s a chart of the Gini index for the U.S. since 1947. (The Gini Index is a widely-used measure of income inequality. A higher Gini number means higher inequality.) Note that the Gini reading started climbing in the late ‘70s – the same time when per capita car ownership in the U.S. began to fall.
This chart tells us, not for the first time, that the U.S. has experienced more income inequality since the 1970s. Combined with the per capita auto sales data above, it suggests that as the rich have gotten richer and everyone else has struggled to keep up, car ownership has suffered. Although this is by no means proof of the relationship between income inequality and per capita car ownership over the last 40 years, it hints at an interesting theory – and suggests that the auto industry has good reason to be concerned about growing inequality in the U.S.

Top Reads From The Fiscal Times:
- 6 Reasons Gas Prices Could Fall Below $2 a Gallon
- Hoping for a Raise? Here’s How Much Most People Are Getting
- What the U.S. Must Do to Avoid Another Financial Crisis
Number of the Day: $132,900

The cap on Social Security payroll taxes will rise to $132,900 next year, an increase of 3.5 percent. (Earnings up to that level are subject to the Social Security tax.) The increase will affect about 11.6 million workers, Politico reports. Beneficiaries are also getting a boost, with a 2.8 percent cost-of-living increase coming in 2019.
Photo of the Day: Kanye West at the White House

This is 2018: Kanye West visited President Trump at the White House Thursday and made a rambling 10-minute statement that aired on TV news networks. West’s lunch with the president was supposed to focus on clemency, crime in his hometown of Chicago and economic investment in urban areas, but his Oval Office rant veered into the bizarre. And since this is the world we live in, we’ll also point out that West apparently became “the first person to ever publicly say 'mother-f***er' in the Oval Office.”
Trump called Kanye’s monologue “pretty impressive.”
“That was bonkers,” MSNBC’s Ali Velshi said afterward.
Again, this is 2018.
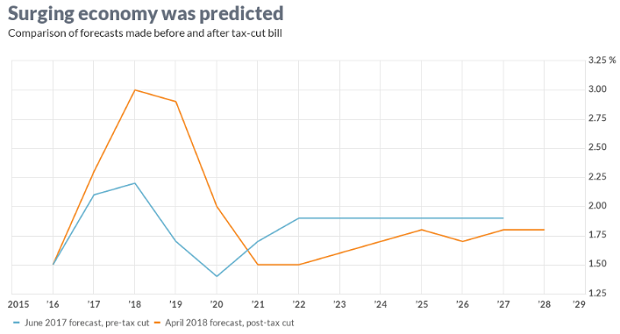
Chart of the Day: GDP Growth Before and After the Tax Bill

President Trump and the rest of the GOP are celebrating the recent burst in economic growth in the wake of the tax cuts, with the president claiming that it’s unprecedented and defies what the experts were predicting just a year ago. But Rex Nutting of MarketWatch points out that elevated growth rates over a few quarters have been seen plenty of times in recent years, and the extra growth generated by the Republican tax cuts was predicted by most economists, including those at the Congressional Budget Office, whose revised projections are shown below.
Are States Ready for the Next Downturn?

The Great Recession hit state budgets hard, but nearly half are now prepared to weather the next modest downturn. Moody’s Analytics says that 23 states have enough reserves to meet budget shortfalls in a moderate economic contraction, up from just 16 last year, Bloomberg reports. Another 10 states are close. The map below shows which states are within 1 percent of their funding needs for their rainy day funds (in green) and which states are falling short.
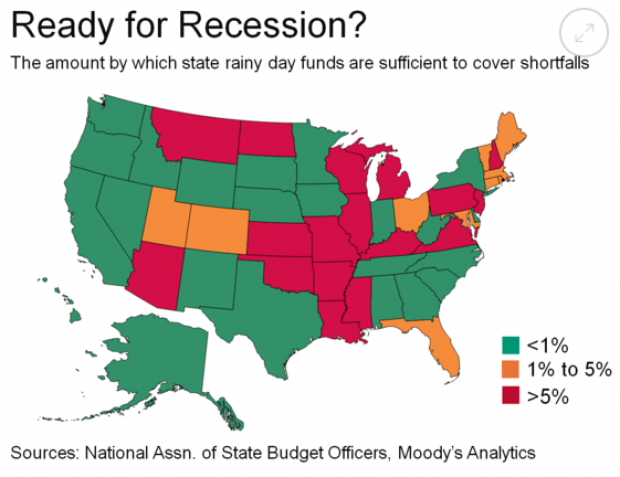
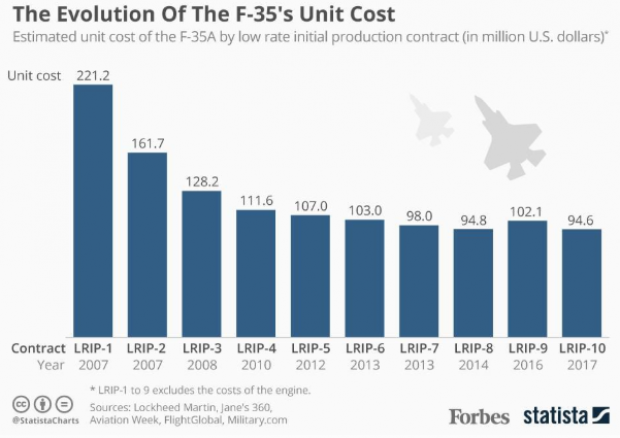
Chart of the Day: Evolving Price of the F-35

The 2019 National Defense Authorization Act signed in August included 77 F-35 Lightning II jets for the Defense Department, but Congress decided to bump up that number in the defense spending bill finalized this week, for a total of 93 in the next fiscal year – 16 more than requested by the Pentagon. Here’s a look from Forbes at the evolving per unit cost of the stealth jet, which is expected to eventually fall to roughly $80 million when full-rate production begins in the next few years.