Automakers Are Having a Record Year, but Here’s a Trend that Should Worry Them

U.S. auto sales closed out the summer on a positive note, topping estimates and casting some rosy light on the health of the American consumer. Recording its best August since 2003, the auto industry is on pace to sell 17.8 vehicles in 2015, well ahead of expectations of 17.3 million. If the numbers hold up, 2015 will be the best year ever for U.S. auto sales, beating the 17.4 million mark set in 2000.
The general consensus is that auto industry is in pretty good shape these days. Gas prices and interest rates are low, boosting the market for cars and light trucks. More than 2 million jobs were added to the U.S. economy in the past year, and more jobs is usually good news for auto sales. The unemployment rate has been trending lower for five years, sitting at a relatively healthy 5.3 percent in July.
Related: What's Next for Oil Prices? Look Out Below!
As with any statistic, though, there’s more than one way to look at the situation. Sure, auto sales are climbing as the economy gets stronger and more Americans hit their local car dealers’ lots. At least to some degree, though, higher auto sales should be expected just as a result of U.S. population growth. And those rising monthly sales figures are masking a continuing trend that is more worrisome for the auto industry: per capita auto sales are still in a long-term decline, even including the solid growth the industry has seen since the end of the recession. Doug Short at Advisor Perspectives did the math and made a graph:

According to Short’s analysis, the peak year for per capita auto sales in the U.S. was 1978. As the red line in the graph shows, the trend is negative since then.
In the graph, per capita auto sales in January, 1976, were defined as 100; the readings in the index since then are relative to that 1976 sales level. As you can see, the index moves higher until August of 1978, when per capita auto sales were up nearly 20 percent over 1976. Since then, per capita auto sales have fallen, reaching a low in 2009 that was nearly 50 percent lower than 1976. Since 2009, per capita auto sales have risen nicely, but are still more than 15 percent below peak.
What could explain the negative trend? Two factors come to mind. First, demographics. It has been widely reported that the millennial generation is less interested in owning cars for a variety of reasons, ranging from a weak economy to a cultural shift away from suburban life. However, the data on millennial car purchases is ambiguous; recently, millennials have started buying cars in volumes that look a lot like their elders. And even if millennials are less interested in buying cars, their preferences can’t explain a shift that began in the 1970s, before they were born.
Related: U.S. Companies Are Dying Faster Than Ever
The other factor that may explain the trend is income inequality. A study of car ownership by the Carnegie Foundation found that countries with higher income inequality have fewer cars per capita. The logic is simple: As more income is claimed by the wealthy, there’s less to go around for everyone else. And that means there’s less money for middle and lower income groups to buy and maintain automobiles, among other things.
Here’s a chart of the Gini index for the U.S. since 1947. (The Gini Index is a widely-used measure of income inequality. A higher Gini number means higher inequality.) Note that the Gini reading started climbing in the late ‘70s – the same time when per capita car ownership in the U.S. began to fall.
This chart tells us, not for the first time, that the U.S. has experienced more income inequality since the 1970s. Combined with the per capita auto sales data above, it suggests that as the rich have gotten richer and everyone else has struggled to keep up, car ownership has suffered. Although this is by no means proof of the relationship between income inequality and per capita car ownership over the last 40 years, it hints at an interesting theory – and suggests that the auto industry has good reason to be concerned about growing inequality in the U.S.

Top Reads From The Fiscal Times:
- 6 Reasons Gas Prices Could Fall Below $2 a Gallon
- Hoping for a Raise? Here’s How Much Most People Are Getting
- What the U.S. Must Do to Avoid Another Financial Crisis
Wages Are Finally Going Up, Sort of

Average hourly earnings last month rose by 2.9 percent from a year earlier, the Labor Department said Friday — the fastest wage growth since the recession ended in 2009. The economy added 201,000 jobs in August, marking the 95th straight month of gains, while the unemployment rate held steady at 3.9 percent.
Analysts noted, though, that the welcome wage gains merely kept pace with a leading measure of inflation, meaning that pay increases are largely or entirely being canceled out by higher prices. “The last time unemployment was this low, during the dot-com boom, wage growth was significantly faster — well above 3.5 percent,” The Washington Post’s Heather Long wrote. The White House Council of Economic Advisers this week issued a report arguing that wage gains over the past year have been better than they appear in official statistics.
Cost of Trump’s Military Parade Rising Fast

It looks like President Trump’s military parade is going to cost a lot more than the initial estimate suggested – about $80 million more.
The Department of Defense pegged the cost of the parade at roughly $12 million back in July, but CNBC reported Thursday that Pentagon officials have increased their estimate to $92 million. The total consists of $50 million from the Defense Department and $42 million from other agencies, including the Department of Homeland Security.
The parade, which President Trump requested after attending a Bastille Day military parade in Paris last year, is scheduled for November 10 and will reportedly include aircraft, armored vehicles and soldiers in period uniforms. Abrams tanks, which weigh roughly 70 tons apiece, will also be included, CNBC said, despite concerns about heavy military equipment ripping up the streets of Washington. A Pentagon analysis apparently found that the armored vehicle’s treads would not cause any damage.
The parade is expected to begin at the Capitol, continue past the White House and end at the National Mall, according to earlier reports from NBC News.
Quote of the Day: Time to Raise Taxes?

“Tax revenue as a percentage of gross domestic product is expected to be 16.5 percent next year. The long-term average in a full-employment economy is 18.5 percent of GDP; if revenue were at that level for the coming decade, debt would be $3.2 trillion lower and the 10-year fiscal gap would be halved. Returning to past revenue levels, however, will be inadequate over time, because an aging population will increase Medicare and Social Security costs. This need not pose a problem: Revenue was roughly 19 percent of GDP in the late 1990s, and economic conditions were excellent.”
– Former U.S. Treasury Secretary Richard E. Rubin, writing in The Washington Post
Quote of the Day: When Tax Cuts Pay for Themselves
“You … often hear the claim that a lot of tax cuts will ‘pay for themselves,’ that they’ll cause so much additional economic activity that the revenue feedback from that activity will fully offset the direct revenue loss caused by the tax cut so that you end up making money for the federal government, or at least not losing any money. Now, of course that is theoretically possible and it would happen at extreme rates. I mean if a country had a 99 percent flat rate income tax and lowered it to 98 percent, I believe that they almost certainly would collect more revenue at the 98 percent rate than they did at the 99 percent rate. But the idea that this type of effect would occur at today’s tax levels just requires responses that are much bigger than statistical evidence would support and I think much bigger than common sense would indicate if you just ask people how they themselves would react to the tax cut.”
-- Alan Viard, tax policy expert at the American Enterprise Institute
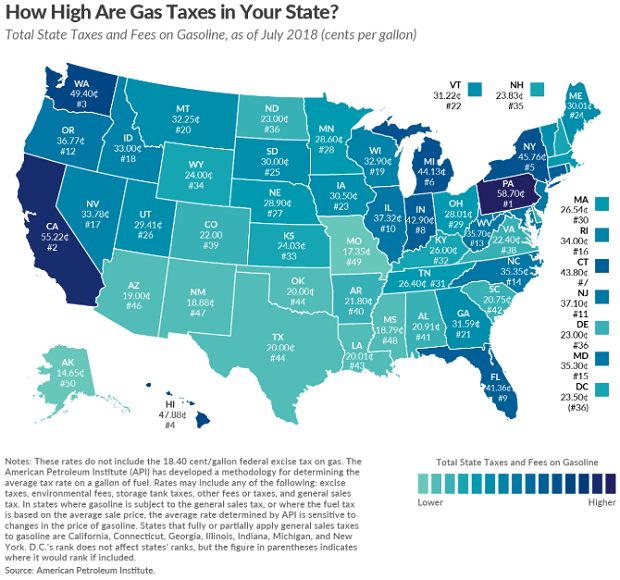
Map of the Day: Gas Taxes

It’s summertime and the driving is anything but easy if you want to get to your favorite beach or mountain cabin for a well-deserved break. As lawmakers consider a plan to raise federal fuel taxes by 15 cents a gallon, here’s a look at the current state-level taxes on gasoline, courtesy of the Tax Foundation: