Automakers Are Having a Record Year, but Here’s a Trend that Should Worry Them

U.S. auto sales closed out the summer on a positive note, topping estimates and casting some rosy light on the health of the American consumer. Recording its best August since 2003, the auto industry is on pace to sell 17.8 vehicles in 2015, well ahead of expectations of 17.3 million. If the numbers hold up, 2015 will be the best year ever for U.S. auto sales, beating the 17.4 million mark set in 2000.
The general consensus is that auto industry is in pretty good shape these days. Gas prices and interest rates are low, boosting the market for cars and light trucks. More than 2 million jobs were added to the U.S. economy in the past year, and more jobs is usually good news for auto sales. The unemployment rate has been trending lower for five years, sitting at a relatively healthy 5.3 percent in July.
Related: What's Next for Oil Prices? Look Out Below!
As with any statistic, though, there’s more than one way to look at the situation. Sure, auto sales are climbing as the economy gets stronger and more Americans hit their local car dealers’ lots. At least to some degree, though, higher auto sales should be expected just as a result of U.S. population growth. And those rising monthly sales figures are masking a continuing trend that is more worrisome for the auto industry: per capita auto sales are still in a long-term decline, even including the solid growth the industry has seen since the end of the recession. Doug Short at Advisor Perspectives did the math and made a graph:

According to Short’s analysis, the peak year for per capita auto sales in the U.S. was 1978. As the red line in the graph shows, the trend is negative since then.
In the graph, per capita auto sales in January, 1976, were defined as 100; the readings in the index since then are relative to that 1976 sales level. As you can see, the index moves higher until August of 1978, when per capita auto sales were up nearly 20 percent over 1976. Since then, per capita auto sales have fallen, reaching a low in 2009 that was nearly 50 percent lower than 1976. Since 2009, per capita auto sales have risen nicely, but are still more than 15 percent below peak.
What could explain the negative trend? Two factors come to mind. First, demographics. It has been widely reported that the millennial generation is less interested in owning cars for a variety of reasons, ranging from a weak economy to a cultural shift away from suburban life. However, the data on millennial car purchases is ambiguous; recently, millennials have started buying cars in volumes that look a lot like their elders. And even if millennials are less interested in buying cars, their preferences can’t explain a shift that began in the 1970s, before they were born.
Related: U.S. Companies Are Dying Faster Than Ever
The other factor that may explain the trend is income inequality. A study of car ownership by the Carnegie Foundation found that countries with higher income inequality have fewer cars per capita. The logic is simple: As more income is claimed by the wealthy, there’s less to go around for everyone else. And that means there’s less money for middle and lower income groups to buy and maintain automobiles, among other things.
Here’s a chart of the Gini index for the U.S. since 1947. (The Gini Index is a widely-used measure of income inequality. A higher Gini number means higher inequality.) Note that the Gini reading started climbing in the late ‘70s – the same time when per capita car ownership in the U.S. began to fall.
This chart tells us, not for the first time, that the U.S. has experienced more income inequality since the 1970s. Combined with the per capita auto sales data above, it suggests that as the rich have gotten richer and everyone else has struggled to keep up, car ownership has suffered. Although this is by no means proof of the relationship between income inequality and per capita car ownership over the last 40 years, it hints at an interesting theory – and suggests that the auto industry has good reason to be concerned about growing inequality in the U.S.

Top Reads From The Fiscal Times:
- 6 Reasons Gas Prices Could Fall Below $2 a Gallon
- Hoping for a Raise? Here’s How Much Most People Are Getting
- What the U.S. Must Do to Avoid Another Financial Crisis
Chart of the Day: SALT in the GOP’s Wounds

The stark and growing divide between urban/suburban and rural districts was one big story in this year’s election results, with Democrats gaining seats in the House as a result of their success in suburban areas. The GOP tax law may have helped drive that trend, Yahoo Finance’s Brian Cheung notes.
The new tax law capped the amount of state and local tax deductions Americans can claim in their federal filings at $10,000. Congressional seats for nine of the top 25 districts where residents claim those SALT deductions were held by Republicans heading into Election Day. Six of the nine flipped to the Democrats in last week’s midterms.
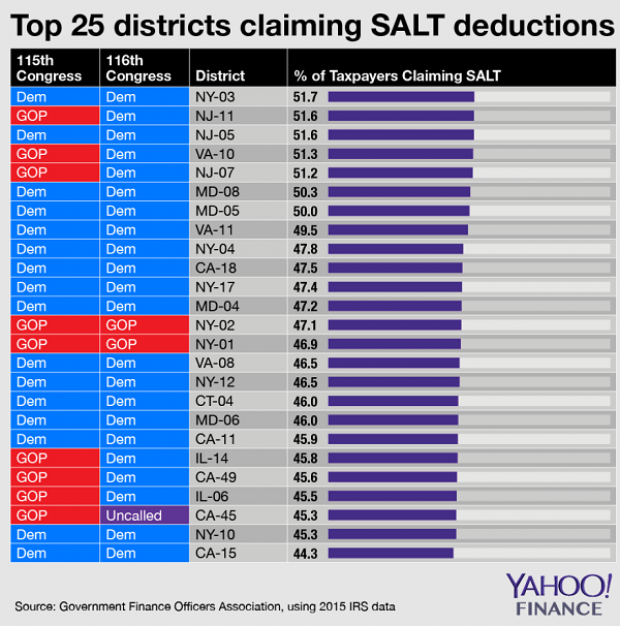
Chart of the Day: Big Pharma's Big Profits
Ten companies, including nine pharmaceutical giants, accounted for half of the health care industry's $50 billion in worldwide profits in the third quarter of 2018, according to an analysis by Axios’s Bob Herman. Drug companies generated 23 percent of the industry’s $636 billion in revenue — and 63 percent of the total profits. “Americans spend a lot more money on hospital and physician care than prescription drugs, but pharmaceutical companies pocket a lot more than other parts of the industry,” Herman writes.
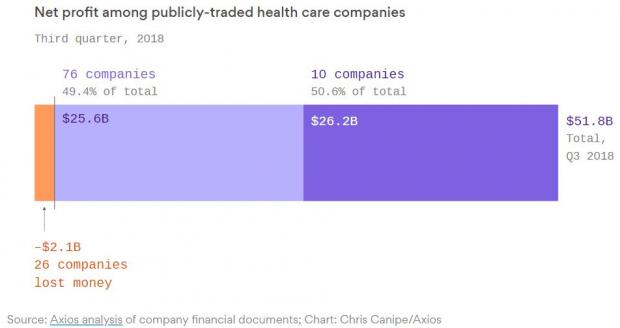
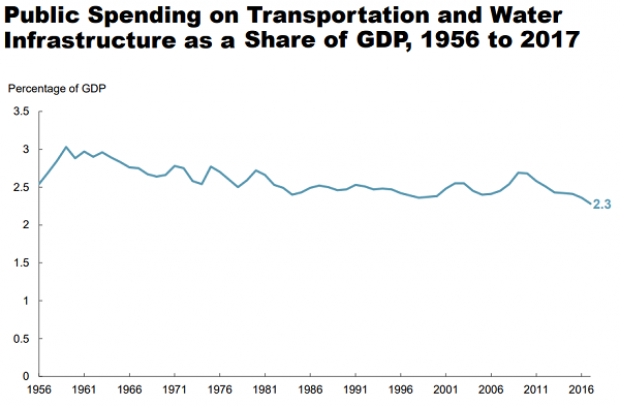
Chart of the Day: Infrastructure Spending Over 60 Years

Federal, state and local governments spent about $441 billion on infrastructure in 2017, with the money going toward highways, mass transit and rail, aviation, water transportation, water resources and water utilities. Measured as a percentage of GDP, total spending is a bit lower than it was 50 years ago. For more details, see this new report from the Congressional Budget Office.
Number of the Day: $3.3 Billion

The GOP tax cuts have provided a significant earnings boost for the big U.S. banks so far this year. Changes in the tax code “saved the nation’s six biggest banks $3.3 billion in the third quarter alone,” according to a Bloomberg report Thursday. The data is drawn from earnings reports from Bank of America, Citigroup, Goldman Sachs, JPMorgan Chase, Morgan Stanley and Wells Fargo.
Clarifying the Drop in Obamacare Premiums
We told you Thursday about the Trump administration’s announcement that average premiums for benchmark Obamacare plans will fall 1.5 percent next year, but analyst Charles Gaba says the story is a bit more complicated. According to Gaba’s calculations, average premiums for all individual health plans will rise next year by 3.1 percent.
The difference between the two figures is produced by two very different datasets. The Trump administration included only the second-lowest-cost Silver plans in 39 states in its analysis, while Gaba examined all individual plans sold in all 50 states.