Automakers Are Having a Record Year, but Here’s a Trend that Should Worry Them

U.S. auto sales closed out the summer on a positive note, topping estimates and casting some rosy light on the health of the American consumer. Recording its best August since 2003, the auto industry is on pace to sell 17.8 vehicles in 2015, well ahead of expectations of 17.3 million. If the numbers hold up, 2015 will be the best year ever for U.S. auto sales, beating the 17.4 million mark set in 2000.
The general consensus is that auto industry is in pretty good shape these days. Gas prices and interest rates are low, boosting the market for cars and light trucks. More than 2 million jobs were added to the U.S. economy in the past year, and more jobs is usually good news for auto sales. The unemployment rate has been trending lower for five years, sitting at a relatively healthy 5.3 percent in July.
Related: What's Next for Oil Prices? Look Out Below!
As with any statistic, though, there’s more than one way to look at the situation. Sure, auto sales are climbing as the economy gets stronger and more Americans hit their local car dealers’ lots. At least to some degree, though, higher auto sales should be expected just as a result of U.S. population growth. And those rising monthly sales figures are masking a continuing trend that is more worrisome for the auto industry: per capita auto sales are still in a long-term decline, even including the solid growth the industry has seen since the end of the recession. Doug Short at Advisor Perspectives did the math and made a graph:

According to Short’s analysis, the peak year for per capita auto sales in the U.S. was 1978. As the red line in the graph shows, the trend is negative since then.
In the graph, per capita auto sales in January, 1976, were defined as 100; the readings in the index since then are relative to that 1976 sales level. As you can see, the index moves higher until August of 1978, when per capita auto sales were up nearly 20 percent over 1976. Since then, per capita auto sales have fallen, reaching a low in 2009 that was nearly 50 percent lower than 1976. Since 2009, per capita auto sales have risen nicely, but are still more than 15 percent below peak.
What could explain the negative trend? Two factors come to mind. First, demographics. It has been widely reported that the millennial generation is less interested in owning cars for a variety of reasons, ranging from a weak economy to a cultural shift away from suburban life. However, the data on millennial car purchases is ambiguous; recently, millennials have started buying cars in volumes that look a lot like their elders. And even if millennials are less interested in buying cars, their preferences can’t explain a shift that began in the 1970s, before they were born.
Related: U.S. Companies Are Dying Faster Than Ever
The other factor that may explain the trend is income inequality. A study of car ownership by the Carnegie Foundation found that countries with higher income inequality have fewer cars per capita. The logic is simple: As more income is claimed by the wealthy, there’s less to go around for everyone else. And that means there’s less money for middle and lower income groups to buy and maintain automobiles, among other things.
Here’s a chart of the Gini index for the U.S. since 1947. (The Gini Index is a widely-used measure of income inequality. A higher Gini number means higher inequality.) Note that the Gini reading started climbing in the late ‘70s – the same time when per capita car ownership in the U.S. began to fall.
This chart tells us, not for the first time, that the U.S. has experienced more income inequality since the 1970s. Combined with the per capita auto sales data above, it suggests that as the rich have gotten richer and everyone else has struggled to keep up, car ownership has suffered. Although this is by no means proof of the relationship between income inequality and per capita car ownership over the last 40 years, it hints at an interesting theory – and suggests that the auto industry has good reason to be concerned about growing inequality in the U.S.

Top Reads From The Fiscal Times:
- 6 Reasons Gas Prices Could Fall Below $2 a Gallon
- Hoping for a Raise? Here’s How Much Most People Are Getting
- What the U.S. Must Do to Avoid Another Financial Crisis
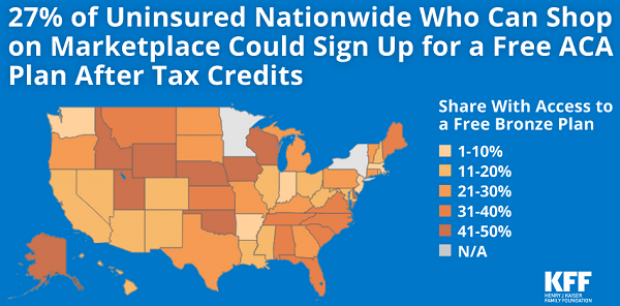
4.2 Million Uninsured People Could Get Free Obamacare Plans

About 4.2 million uninsured people could sign up for a bronze-level Obamacare health plan and pay nothing for it after tax credits are applied, the Kaiser Family Foundation said Tuesday. That means that 27 percent of the country’s 15.9 million uninsured people could get covered for free. The chart below breaks down the eligible population by state.
Takedown of the Day: Ezra Klein on Paul Ryan's Legacy of Debt

Vox’s Ezra Klein says that retiring House Speaker Paul Ryan’s legacy can be summed up in one number: $343 billion. “That’s the increase between the deficit for fiscal year 2015 and fiscal year 2018— that is, the difference between the fiscal year before Ryan became speaker of the House and the fiscal year in which he retired.”
Klein writes that Ryan’s choices while in office — especially the 2017 tax cuts and the $1.3 trillion spending bill he helped pass and the expansion of the earned income tax credit he talked up but never acted on — should be what define his legacy:
“[N]ow, as Ryan prepares to leave Congress, it is clear that his critics were correct and a credulous Washington press corps — including me — that took him at his word was wrong. In the trillions of long-term debt he racked up as speaker, in the anti-poverty proposals he promised but never passed, and in the many lies he told to sell unpopular policies, Ryan proved as much a practitioner of post-truth politics as Donald Trump. …
“Ultimately, Ryan put himself forward as a test of a simple, but important, proposition: Is fiscal responsibility something Republicans believe in or something they simply weaponize against Democrats to win back power so they can pass tax cuts and defense spending? Over the past three years, he provided a clear answer. That is his legacy, and it will haunt his successors.”
Number of the Day: $300 Million
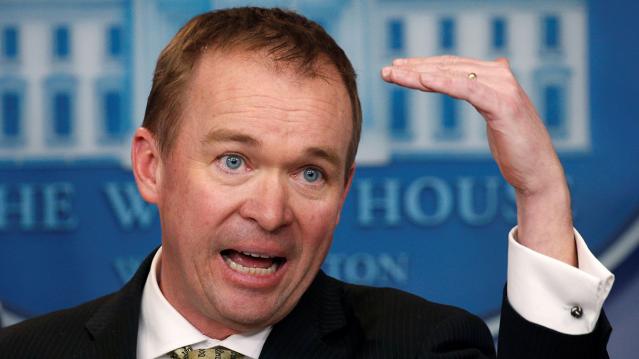
Mick Mulvaney, the acting director of the Consumer Financial Protection Bureau, wants the agency to be known as the Bureau of Consumer Financial Protection, the name under which it was established by Title X of the 2010 Dodd-Frank Wall Street reform law. Mulvaney even had new signage put up in the lobby of the bureau. But the rebranding could cost the banks and other financial businesses regulated by the bureau more than $300 million, according to an internal agency analysis reported by The Hill’s Sylvan Lane. The costs would arise from having to update internal databases, regulatory filings and disclosure forms with the new name. The rebranding would cost the agency itself between $9 million and $19 million, the analysis estimated. Lane adds that it’s not clear whether Kathy Kraninger, President Trump’s nominee to serve as the bureau’s full-time director, would follow through on Mulvaney’s name change once she is confirmed by the Senate.
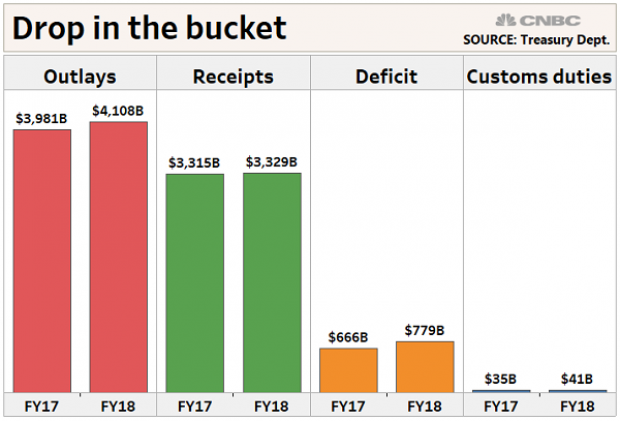
Why Trump's Tariffs Are Just a Drop in the Bucket

President Trump said this week that tariff increases by his administration are producing "billions of dollars" in revenues, thereby improving the country’s fiscal situation. But CNBC’s John Schoen points out that while tariff revenues are indeed higher by several billion dollars this year, the total revenue is a drop in the bucket compared to the sheer size of government outlays and receipts – and the growing annual deficit.
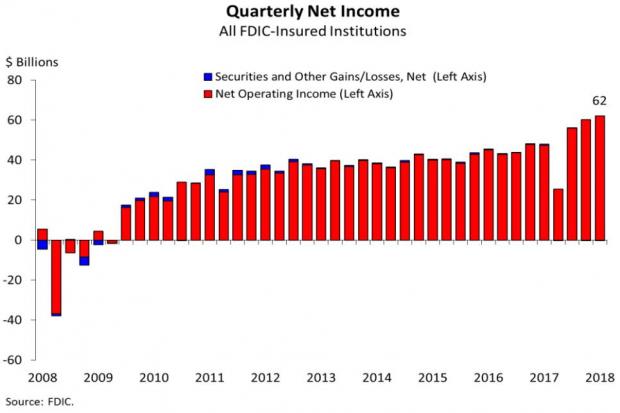
Bank Profits Hit New Record Thanks to 2017 Tax Law
Bank profits reached a record $62 billion in the third quarter, up $14 billion, or 29.3 percent, from the same period last year, according to data from the Federal Deposit Insurance Corporation. The FDIC said that about half of the increase in net income was attributable to last year’s tax cuts. The FDIC estimated that, with the effective tax rates from before the new law, bank profits for the quarter would have risen by about 14 percent, to $54.6 billion.