Automakers Are Having a Record Year, but Here’s a Trend that Should Worry Them

U.S. auto sales closed out the summer on a positive note, topping estimates and casting some rosy light on the health of the American consumer. Recording its best August since 2003, the auto industry is on pace to sell 17.8 vehicles in 2015, well ahead of expectations of 17.3 million. If the numbers hold up, 2015 will be the best year ever for U.S. auto sales, beating the 17.4 million mark set in 2000.
The general consensus is that auto industry is in pretty good shape these days. Gas prices and interest rates are low, boosting the market for cars and light trucks. More than 2 million jobs were added to the U.S. economy in the past year, and more jobs is usually good news for auto sales. The unemployment rate has been trending lower for five years, sitting at a relatively healthy 5.3 percent in July.
Related: What's Next for Oil Prices? Look Out Below!
As with any statistic, though, there’s more than one way to look at the situation. Sure, auto sales are climbing as the economy gets stronger and more Americans hit their local car dealers’ lots. At least to some degree, though, higher auto sales should be expected just as a result of U.S. population growth. And those rising monthly sales figures are masking a continuing trend that is more worrisome for the auto industry: per capita auto sales are still in a long-term decline, even including the solid growth the industry has seen since the end of the recession. Doug Short at Advisor Perspectives did the math and made a graph:

According to Short’s analysis, the peak year for per capita auto sales in the U.S. was 1978. As the red line in the graph shows, the trend is negative since then.
In the graph, per capita auto sales in January, 1976, were defined as 100; the readings in the index since then are relative to that 1976 sales level. As you can see, the index moves higher until August of 1978, when per capita auto sales were up nearly 20 percent over 1976. Since then, per capita auto sales have fallen, reaching a low in 2009 that was nearly 50 percent lower than 1976. Since 2009, per capita auto sales have risen nicely, but are still more than 15 percent below peak.
What could explain the negative trend? Two factors come to mind. First, demographics. It has been widely reported that the millennial generation is less interested in owning cars for a variety of reasons, ranging from a weak economy to a cultural shift away from suburban life. However, the data on millennial car purchases is ambiguous; recently, millennials have started buying cars in volumes that look a lot like their elders. And even if millennials are less interested in buying cars, their preferences can’t explain a shift that began in the 1970s, before they were born.
Related: U.S. Companies Are Dying Faster Than Ever
The other factor that may explain the trend is income inequality. A study of car ownership by the Carnegie Foundation found that countries with higher income inequality have fewer cars per capita. The logic is simple: As more income is claimed by the wealthy, there’s less to go around for everyone else. And that means there’s less money for middle and lower income groups to buy and maintain automobiles, among other things.
Here’s a chart of the Gini index for the U.S. since 1947. (The Gini Index is a widely-used measure of income inequality. A higher Gini number means higher inequality.) Note that the Gini reading started climbing in the late ‘70s – the same time when per capita car ownership in the U.S. began to fall.
This chart tells us, not for the first time, that the U.S. has experienced more income inequality since the 1970s. Combined with the per capita auto sales data above, it suggests that as the rich have gotten richer and everyone else has struggled to keep up, car ownership has suffered. Although this is by no means proof of the relationship between income inequality and per capita car ownership over the last 40 years, it hints at an interesting theory – and suggests that the auto industry has good reason to be concerned about growing inequality in the U.S.

Top Reads From The Fiscal Times:
- 6 Reasons Gas Prices Could Fall Below $2 a Gallon
- Hoping for a Raise? Here’s How Much Most People Are Getting
- What the U.S. Must Do to Avoid Another Financial Crisis
Why Craft Brewers Are Crying in Their Beer

It may be small beer compared to the problems faced by unemployed federal workers and the growing cost for the overall economy, but the ongoing government shutdown is putting a serious crimp in the craft brewing industry. Small-batch brewers tend to produce new products on a regular basis, The Wall Street Journal’s Ruth Simon says, but each new formulation and product label needs to be approved by the Treasury Department’s Alcohol and Tobacco Tax and Trade Bureau, which is currently closed. So it looks like you’ll have to wait a while to try the new version of Hemperor HPA from Colorado’s New Belgium Brewing, a hoppy brew that will include hemp seeds once the shutdown is over.
Number of the Day: $30 Billion

The amount spent on medical marketing reached $30 billion in 2016, up from $18 billion in 1997, according to a new analysis published in the Journal of the American Medical Association and highlighted by the Associated Press. The number of advertisements for prescription drugs appearing on television, newspapers, websites and elsewhere totaled 5 million in one year, accounting for $6 billion in marketing spending. Direct-to-consumer marketing grew the fastest, rising from $2 billion, or 12 percent of total marketing, to nearly $10 billion, or a third of spending. “Marketing drives more treatments, more testing” that patients don’t always need, Dr. Steven Woloshin, a Dartmouth College health policy expert and co-author of the study, told the AP.
70% of Registered Voters Want a Compromise to End the Shutdown

An overwhelming majority of registered voters say they want the president and Congress to “compromise to avoid prolonging the government shutdown” in a new The Hill-HarrisX poll. Seven in ten respondents said they preferred the parties reach some sort of deal to end the standoff, while 30 percent said it was more important to stick to principles, even if it means keeping parts of the government shutdown. Voters who “strongly approve” of Trump (a slim 21 percent of respondents) favored him sticking to his principles over the wall by a narrow 54 percent-46 percent margin. Voters who “somewhat approve” of the president favored a compromise solution by a 70-30 margin. Among Republicans overall, 61 percent said they wanted a compromise.
The survey of 1,000 registered voters was conducted January 5 and 6 and has a margin of error of 3.1 percentage points.
Share Buybacks Soar to Record $1 Trillion
Although there may be plenty of things in the GOP tax bill to complain about, critics can’t say it didn’t work – at least as far as stock buybacks go. TrimTabs Investment Research said Monday that U.S. companies have now announced $1 trillion in share buybacks in 2018, surpassing the record of $781 billion set in 2015. "It's no coincidence," said TrimTabs' David Santschi. "A lot of the buybacks are because of the tax law. Companies have more cash to pump up the stock price."
Chart of the Day: Deficits Rising
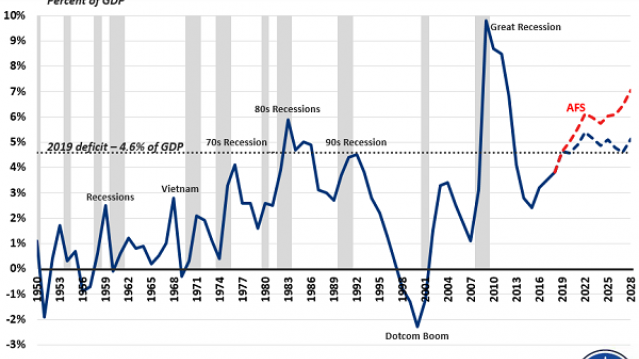
Budget deficits normally rise during recessions and fall when the economy is growing, but that’s not the case today. Deficits are rising sharply despite robust economic growth, increasing from $666 billion in 2017 to an estimated $970 billion in 2019, with $1 trillion annual deficits expected for years after that.
As the deficit hawks at the Committee for a Responsible Federal Budget point out in a blog post Thursday, “the deficit has never been this high when the economy was this strong … And never in modern U.S. history have deficits been so high outside of a war or recession (or their aftermath).” The chart above shows just how unusual the current deficit path is when measured as a percentage of GDP.