The Most Expensive Cities for Singles -- and the Cheapest

Looking for love in all the pricey places? Check out these lists of the most and least expensive cities for singles before you go on that next date or plan your next move. Looking good doesn’t come cheap, and the price of a decent wardrobe and a gym membership add ups before you even step out the door.
To determine which cities were the least and most affordable for singles, GoBankingRates examined 89 cities and rated them according to four expense categories -- clothing, dates, gym memberships and rent -- using data from Numbeo.com. “Singles are more likely to exercise, and to have a gym membership,” says Elyssa Kirkham, a finance writer for GoBankingRates. “They’re more likely to rent than own a home, and spend more money on dates and clothing.”
Related: Hot New Dating Criteria: What’s Your Credit Score?
San Francisco is the most expensive city for singles, especially when it comes to rent. Rent is 30 percent more expensive in San Francisco than it is in Honolulu. The cost of a date here is $147, compared with the median cost of $109. California just might be the most expensive state to date in, claiming seven of the top 15 spots: San Francisco, Fremont, Glendale, Irvine, Los Angeles, San Diego and Oakland.
The second most expensive city? New York City, which boasts the most expensive gym membership at $90 per month. Clothing costs here are the second-highest in the nation -- bad news for all the Carrie Bradshaws out there. And date night will set you back $145.
The most expensive date night in the country is in Washington, D.C., which came in third overall. Date night in our nation’s capital costs $166 for dinner, a bottle of wine, two movie tickets and a 10-mile taxi ride. Compare that to Chattanooga, Tennessee, which had the cheapest date night at $78.
Looking for more bang for your buck? Move to Reno, Nevada. Rent here is just 86 cents per square foot, and a night out averages $97.30. Keep in mind, though, that “the Biggest Little City in the World” was once known as the divorce capital of the world, so dating there may offer less promise than other locales.
Related: The Bad News About All the Singles in America
Most Expensive Cities for Singles
- San Francisco
- New York
- Washington, D.C.
- Honolulu
- Boston
- Fremont, California
- Glendale, California
- Anchorage, Alaska
- Miami
- Seattle
- Irvine, California
- Los Angeles
- San Diego
- Oakland, California
- Madison, Wisconsin
Related: Marriage?? Young Americans Aren’t Even Shacking Up
15 Cheapest Cities for Singles
- Reno, Nevada
- Tucson, Arizona
- Grand Rapids, Michigan
- Tacoma, Washington
- Indianapolis
- Mesa, Arizona
- Little Rock, Arkansas
- Albuquerque, New Mexico
- Huntsville, Alabama
- Memphis, Tennessee
- St. Louis, Missouri
- Jackson, Mississippi
- Stockton, California
- Omaha, Nebraska
- Chattanooga, Tennessee
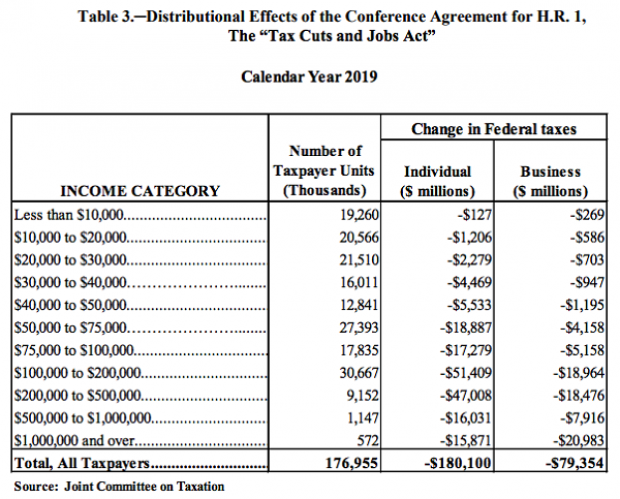
Majority of Tax Cuts Going to Filers Earning More Than $100K: JCT

Ahead of a House Ways and Means Committee hearing scheduled for Wednesday, the Joint Committee on Taxation prepared an analysis of the distributional effects of the 2017 Republican tax bill. The New York Times’ Jim Tankersley highlighted the fact that according to the JCT analysis, about 75 percent of the individual and business benefits of the tax cuts will go to filers earning more than $100,000 in 2019. And nearly half of the benefits will flow to filers earning over $200,000.
The Trump Budget's $1.2 Trillion in 'Phantom Revenues'
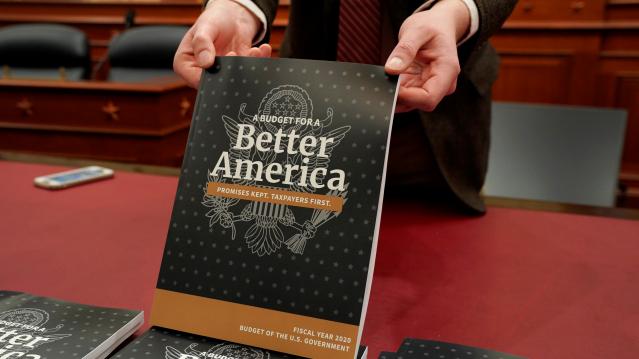
President Trump’s 2020 budget includes up to $1.2 trillion in “potentially phantom revenues” — money that comes from taxes the administration opposes or from tax hikes that face strong opposition from businesses, The Wall Street Journal’s Richard Rubin reports, citing data from the Committee for a Responsible Federal Budget. That total, covering 2020 through 2029, includes as much as $390 billion in taxes created under the Affordable Care Act, which the president wants to repeal.
The $1.2 trillion in questionable revenue projections is in addition to the White House budget’s projected deficits of $7.3 trillion for the 10-year period. That total is itself questionable, given that the president’s budget relies on optimistic assumptions about economic growth and some unrealistic spending cuts, meaning that the deficits could be significantly higher than projected.
Republicans Push Ahead on Medicaid Restrictions

The Trump administration on Friday approved Ohio’s request to impose work requirements on Medicaid recipients. Starting in 2021, the state will require most able-bodied adults aged 19 to 49 to either work, go to school, be in job training or volunteer for 80 hours a month in order to receive Medicaid benefits. Those who fail to meet the requirements over 60 days will be removed from the system, although they can reapply immediately.
The new work requirements include exemptions for pregnant women, caretakers and those living in counties with high unemployment rates and will apply only to those covered through the expansion of Medicaid under the Affordable Care Act. There are currently about 540,000 people on Medicaid in Ohio who receive coverage through the expansion, according to Kaitlin Schroeder of The Dayton Daily News, compared to roughly 2.6 million Medicaid recipients in the state overall.
Once implemented, the work requirements are expected to result in 36,000 people losing their Medicaid eligibility, according to state officials, though critics say the reductions could be significantly larger. Similar work requirements in Arkansas pushed 18,000 people off the Medicaid rolls in six months.
A larger GOP project: The creation of new work requirements is part of a larger effort by Republicans to limit the expansion of Medicaid, says The Wall Street Journal’s Stephanie Armour. Since the Affordable Care Act passed in 2010, 36 states have expanded their Medicaid programs under the ACA and the number of people in the program has grown by 50 percent, from roughly 50 million to about 75 million. But many red-state governors have expressed concerns about the cost of Medicaid expansion and worries about a lack of self-sufficiency among the able-bodied poor, and are embracing new limitations on the program for both fiscal and political reasons.
In 2017, the White House in 2017 gave states the green light to explore ways to limit the reach and expense of their Medicaid programs. Governors have proposed a variety of new rules, which require waivers from the federal government to enact. Kentucky, for example, wants to drug-test Medicaid recipients, and Utah wants a partial expansion and a cap on payments. Kaiser Health News summarizes the variety of waivers states have requested, which are governed by Section 1115 of the Social Security Act, in the chart below.
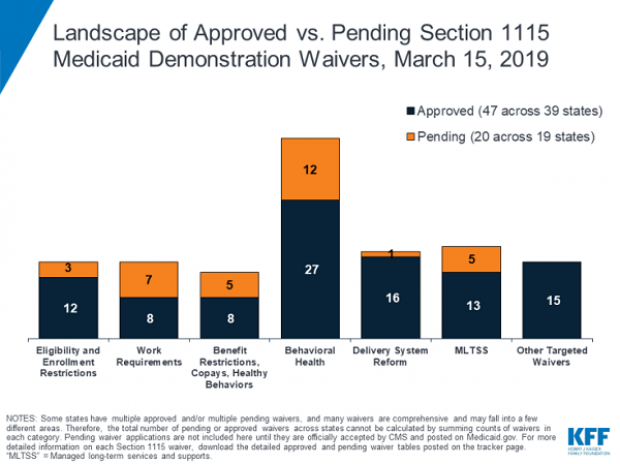
Legal challenges: Efforts to restrict Medicaid have received legal challenges, and U.S. District Judge James Boasberg blocked work requirements in Kentucky last year. The same judge, who has expressed doubts about the administration’s approach to Medicaid, will rule on the legality of work requirements in both Kentucky and Arkansas by April 1.
The bottom line: The Trump administration is seeking fundamental changes in how Medicaid works. Even if Boasberg rules against work requirements, expect the White House and Republican governors to continue to push for new limitations on the program.
Chart of the Day: Trump's Huge Proposed Cuts to Public Investment
Ben Ritz of the Progressive Policy Institute slams President Trump’s new budget:
“It would dismantle public investments that lay the foundation for economic growth, resulting in less innovation. It would shred the social safety net, resulting in more poverty. It would rip away access to affordable health care, resulting in more disease. It would cut taxes for the rich, resulting in more income inequality. It would bloat the defense budget, resulting in more wasteful spending. And all this would add up to a higher national debt than the policies in President Obama’s final budget proposal.”
Here’s Ritz’s breakdown of Trump’s proposed spending cuts to public investment in areas such as infrastructure, education and scientific research:
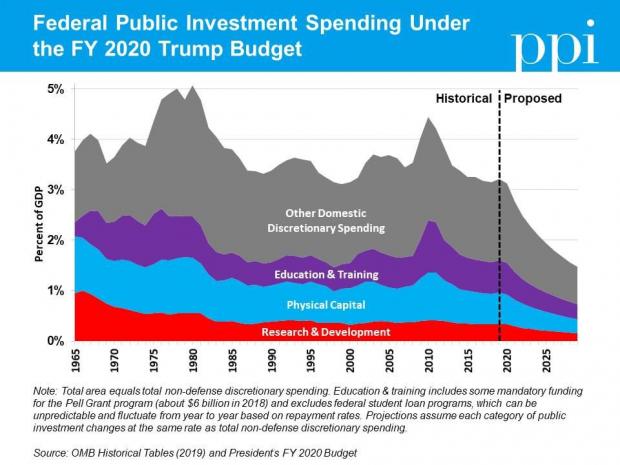
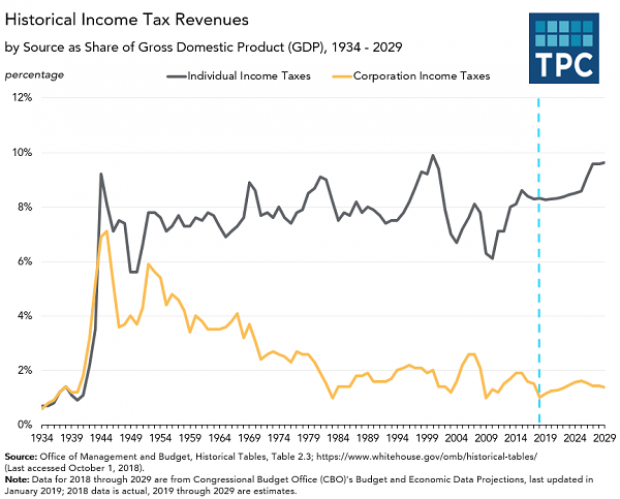
Chart of the Day: The Decline in Corporate Taxes

Since roughly the end of World War Two, individual income taxes in the U.S. have equaled about 8 percent of GDP. By contrast, the Tax Policy Center says, “corporate income tax revenues declined from 6% of GDP in 1950s to under 2% in the 1980s through the Great Recession, and have averaged 1.4% of GDP since then.”