The Most Expensive Cities for Singles -- and the Cheapest
Looking for love in all the pricey places? Check out these lists of the most and least expensive cities for singles before you go on that next date or plan your next move. Looking good doesn’t come cheap, and the price of a decent wardrobe and a gym membership add ups before you even step out the door.
To determine which cities were the least and most affordable for singles, GoBankingRates examined 89 cities and rated them according to four expense categories -- clothing, dates, gym memberships and rent -- using data from Numbeo.com. “Singles are more likely to exercise, and to have a gym membership,” says Elyssa Kirkham, a finance writer for GoBankingRates. “They’re more likely to rent than own a home, and spend more money on dates and clothing.”
Related: Hot New Dating Criteria: What’s Your Credit Score?
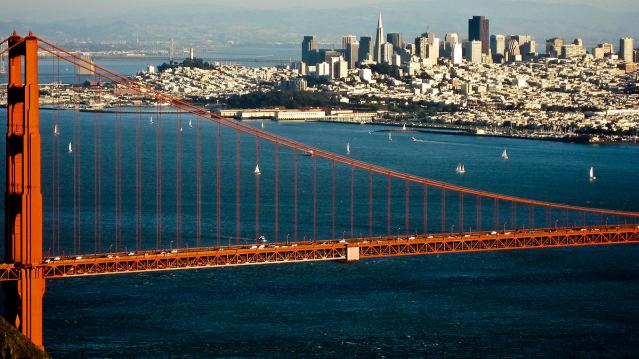
San Francisco is the most expensive city for singles, especially when it comes to rent. Rent is 30 percent more expensive in San Francisco than it is in Honolulu. The cost of a date here is $147, compared with the median cost of $109. California just might be the most expensive state to date in, claiming seven of the top 15 spots: San Francisco, Fremont, Glendale, Irvine, Los Angeles, San Diego and Oakland.
The second most expensive city? New York City, which boasts the most expensive gym membership at $90 per month. Clothing costs here are the second-highest in the nation -- bad news for all the Carrie Bradshaws out there. And date night will set you back $145.
The most expensive date night in the country is in Washington, D.C., which came in third overall. Date night in our nation’s capital costs $166 for dinner, a bottle of wine, two movie tickets and a 10-mile taxi ride. Compare that to Chattanooga, Tennessee, which had the cheapest date night at $78.
Looking for more bang for your buck? Move to Reno, Nevada. Rent here is just 86 cents per square foot, and a night out averages $97.30. Keep in mind, though, that “the Biggest Little City in the World” was once known as the divorce capital of the world, so dating there may offer less promise than other locales.
Related: The Bad News About All the Singles in America
Most Expensive Cities for Singles
- San Francisco
- New York
- Washington, D.C.
- Honolulu
- Boston
- Fremont, California
- Glendale, California
- Anchorage, Alaska
- Miami
- Seattle
- Irvine, California
- Los Angeles
- San Diego
- Oakland, California
- Madison, Wisconsin
Related: Marriage?? Young Americans Aren’t Even Shacking Up
15 Cheapest Cities for Singles
- Reno, Nevada
- Tucson, Arizona
- Grand Rapids, Michigan
- Tacoma, Washington
- Indianapolis
- Mesa, Arizona
- Little Rock, Arkansas
- Albuquerque, New Mexico
- Huntsville, Alabama
- Memphis, Tennessee
- St. Louis, Missouri
- Jackson, Mississippi
- Stockton, California
- Omaha, Nebraska
- Chattanooga, Tennessee
Tax Refunds Rebound
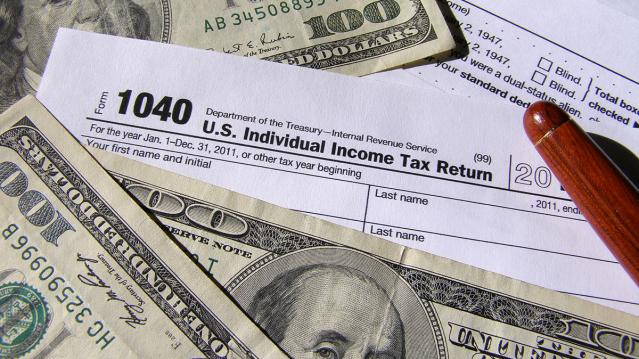
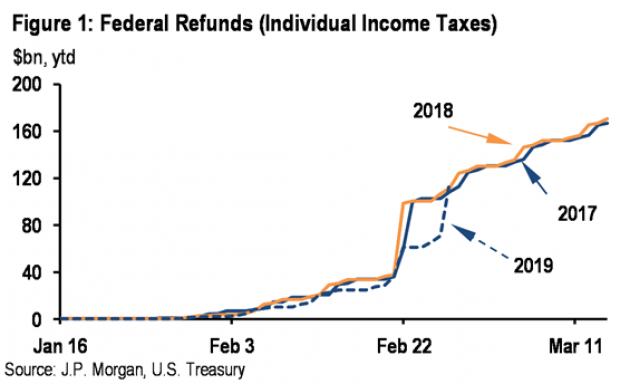
Smaller refunds in the first few weeks of the current tax season were shaping up to be a political problem for Republicans, but new data from the IRS shows that the value of refund checks has snapped back and is now running 1.3 percent higher than last year. The average refund through February 23 last year was $3,103, while the average refund through February 22 of 2019 was $3,143 – a difference of $40. The chart below from J.P. Morgan shows how refunds performed over the last 3 years.
Number of the Day: $22 Trillion
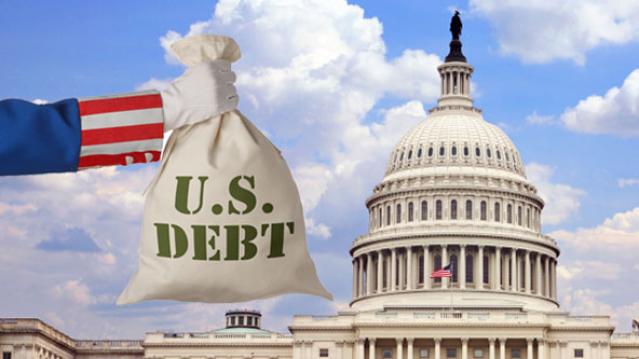
The total national debt surpassed $22 trillion on Monday. Total public debt outstanding reached $22,012,840,891,685.32, to be exact. That figure is up by more than $1.3 trillion over the past 12 months and by more than $2 trillion since President Trump took office.
Chart of the Week: The Soaring Cost of Insulin
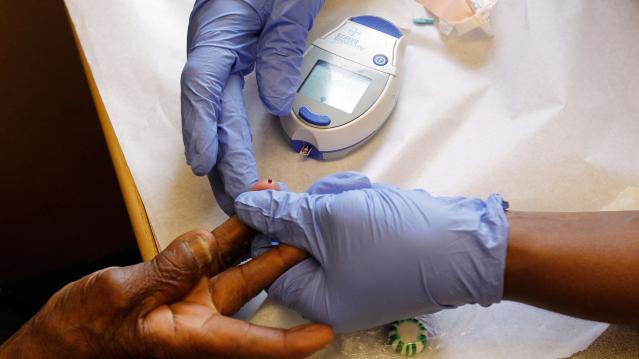
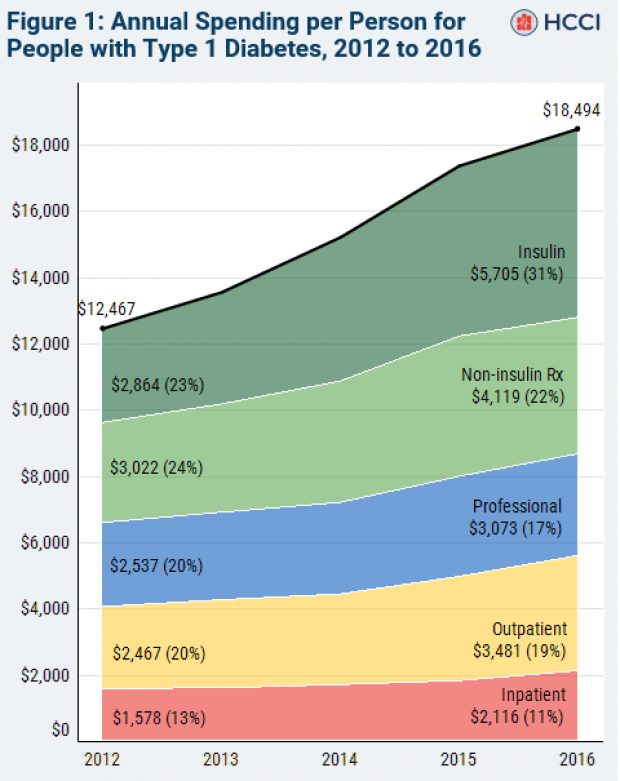
The cost of insulin used to treat Type 1 diabetes nearly doubled between 2012 and 2016, according to an analysis released this week by the Health Care Cost Institute. Researchers found that the average point-of-sale price increased “from $7.80 a day in 2012 to $15 a day in 2016 for someone using an average amount of insulin (60 units per day).” Annual spending per person on insulin rose from $2,864 to $5,705 over the five-year period. And by 2016, insulin costs accounted for nearly a third of all heath care spending for those with Type 1 diabetes (see the chart below), which rose from $12,467 in 2012 to $18,494.
Chart of the Day: Shutdown Hits Like a Hurricane
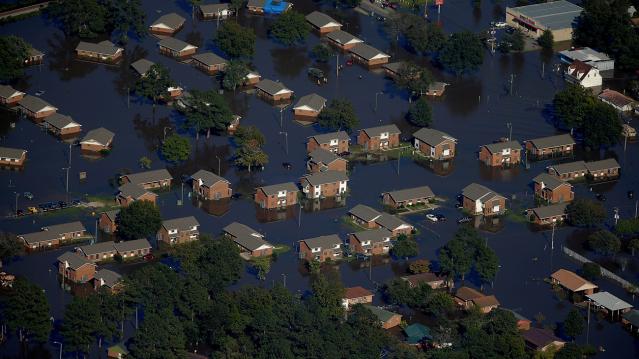
The partial government shutdown has hit the economy like a hurricane – and not just metaphorically. Analysts at the Committee for a Responsible Federal Budget said Tuesday that the shutdown has now cost the economy about $26 billion, close to the average cost of $27 billion per hurricane calculated by the Congressional Budget Office for storms striking the U.S. between 2000 and 2015. From an economic point of view, it’s basically “a self-imposed natural disaster,” CRFB said.
Chart of the Week: Lowering Medicare Drug Prices

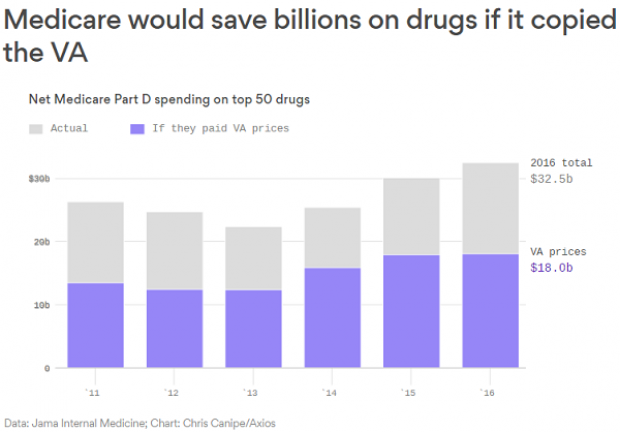
The U.S. could save billions of dollars a year if Medicare were empowered to negotiate drug prices directly with pharmaceutical companies, according to a paper published by JAMA Internal Medicine earlier this week. Researchers compared the prices of the top 50 oral drugs in Medicare Part D to the prices for the same drugs at the Department of Veterans Affairs, which negotiates its own prices and uses a national formulary. They found that Medicare’s total spending was much higher than it would have been with VA pricing.
In 2016, for example, Medicare Part D spent $32.5 billion on the top 50 drugs but would have spent $18 billion if VA prices were in effect – or roughly 45 percent less. And the savings would likely be larger still, Axios’s Bob Herman said, since the study did not consider high-cost injectable drugs such as insulin.

