Here’s a riddle for you: Today, there are 1.2 million more 25-to-54-year-old American workers who are unemployed than there were in 2007 (adjusting for population growth). But 3.7 million fewer of them have jobs. How can that be?
The answer, it turns out, comes from high school chemistry.
Before I confuse you any more, let me explain what this is all about.
Why the Unemployment Rate Does a Bad Job
The latest monthly jobs numbers from the Labor Department came out this morning. As usual, the headlines are ricocheting around the wonk world.
Employers added 214,000 jobs in October as unemployment declined to 5.8 percent—the 49th consecutive month of job gains.
Related: Two New Signs the Economy Really Is Getting Better
It’s taken five years, but finally, declare the soothsayers of finance, we’re back on track. So it’s time for the Fed to start monetary tightening—quick!—before inflation makes our dollars worth less than a Democratic campaign sticker.
There’s just one problem with that headline view of the labor market: it’s almost certainly wrong.
True, the unemployment rate looks pretty good. At 5.8 percent, it’s made it four-fifths of the way back from its recessionary peak to its pre-recession norm. Heck, it’s nearly at the level the Congressional Budget Office considers “natural.”
But considered in isolation, the unemployment rate hides the fact that things are not going very well for a sizable share of America’s workers. The reason is that the unemployment rate excludes the most challenging parts of the labor market recovery.
To be counted as unemployed, you have to be actively looking for a job. Those who have endured long bouts of unemployment and given up hope of finding work are left out of the calculation. So when we see the unemployment rate declining, it might be that hiring is picking up. But it could also be the case that more people are dropping out. Without additional information, we can’t tell.
A Better Measure
A more comprehensive measure of labor market health would factor participation into unemployment.
Fortunately, such a measure exists. It’s called the employment-population ratio, and it’s right there in the monthly jobs report—even if doesn’t make the 140-character cut.
Despite sounding complicated, the E-P ratio measures what exactly it says it does, the number of employed persons divided by the total working age population. A higher ratio is better. The E-P ratio declines if either unemployment increases or participation falls.
Related: New Evidence of How Unemployment Wrecks Families
To understand how the E-P ratio works, let’s look at trends among prime-age workers 25 to 54 years old. During the recession, unemployment among prime-age workers reached 9.0 percent. Today, it’s back down to 4.9 percent. But labor force participation has actually gotten worse, falling from an average of 83.0 percent during the recession to 80.8 percent in October.
As a result, the prime-age E-P ratio, which averaged 79.4 percent from 2003 to 2007, has rebounded much more slowly than the unemployment rate, rising from a low of 75.1 percent to just 76.9 percent today. Suddenly, things seem a bit less optimistic.
Grade Inflation
Which brings us back to high school.
As a student at Staten Island Tech in 2000, I was lucky enough to have Ms. Carr for chemistry. Ms. Carr was a kindhearted soul—the kind of teacher who would sooner give you a hug than a homework assignment. When it came time for tests, she couldn’t help but be compassionate. If we found some questions particularly hard, she would give us hints, or, better yet, not count the tough questions when she was computing our grades.
Her generous math made for nice looking report cards, though of course our artificially inflated grades implied we knew a bit more than we actually did—especially compared to our (understandably jealous) peers who had less charitable teachers.
Related: Why Hasn’t the Unemployment Rate Fallen in Half the States?
But Ms. Carr knew what she was doing, and was always careful to remind us not to let her forgiving standards give us a false sense of confidence. We had year-end state exams, after all—and there would be no breaks or bonuses then.
Those students who failed to heed her advice—the ones who deluded themselves into believing their inflated grades reflected reality—struggled to pass. But the ones who understood how to accurately interpret their performance repaid Ms. Carr’s kindness by working harder, and they succeeded with flying colors.
Tough Questions About Today’s Labor Market
Our present labor market situation is a lot like Ms. Carr’s chemistry classroom.
By not counting the dropouts, many media accounts—and even some serious policymakers—paint an overly rosy portrait of job market health. It’s the economic equivalent of grade inflation.
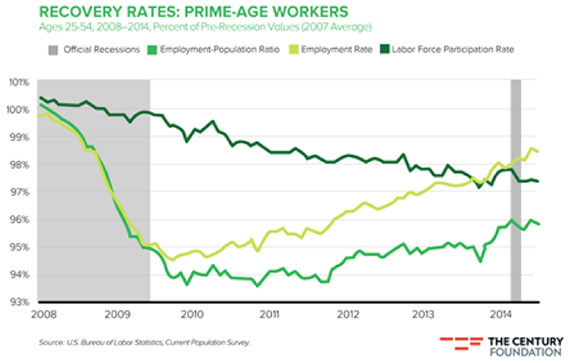
Unfortunately, it’s not a trivial omission. The graph below, taken from my in-depth report released this week by The Century Foundation, makes the disparate implications clear. It plots the recovery rates of three key labor market indicators for prime-age workers. As you can see, the employment rate (the complement of the unemployment rate) is most of the way back to normal. But labor force participation has steadily declined.

Consequently, the E-P ratio, which is the product of the other two, has responded much more sluggishly. It has recovered just two-fifths of its recessionary losses. If the E-P ratio were back to its 2007 level, 3.7 million more prime-age workers would be working. Instead, they’re still sitting on the sidelines.
Looking at the unemployment rate alone, we’d miss this. By ignoring the dropouts, we’d incorrectly conclude the continued impact of the recession on employment consisted of just 1.2 million unemployed prime-age workers. So there’s the answer to our puzzle: Our main measure of the labor market was leaving out the most difficult questions.
If, like Ms. Carr’s myopic students, we delude ourselves into thinking the partial evaluation (unemployment) is indicative of true performance (unemployment and participation), we are at risk for premature policy tightening—removing the band-aid before the wound is healed and exposing the injury to further damage. Only through an honest assessment of our standing can we avoid a rude awakening for our policy grades.
But Ms. Carr could have told you that.
Top Reads from The Fiscal Times:


