It’s been six years since Lehman Brothers collapsed into bankruptcy in the midst of the financial crisis.
It’s been more than five years since the U.S. officially emerged from the Great Recession.
The recovery since then can be measured in numerous ways: Corporate profits have reached record levels, as has the U.S. stock market. Gross domestic product has rebounded from a recession low of $14.4 trillion and should surpass $17 trillion for the first time this year. Even adjusting for inflation, GDP has grown by about $1.3 trillion, or roughly 9 percent, from 2009 to 2013. It grew at a healthy annual rate of 4.2 percent in the second quarter and economists generally expect more solid growth ahead.
Related: The Job Market’s Hot Streak Is Over…
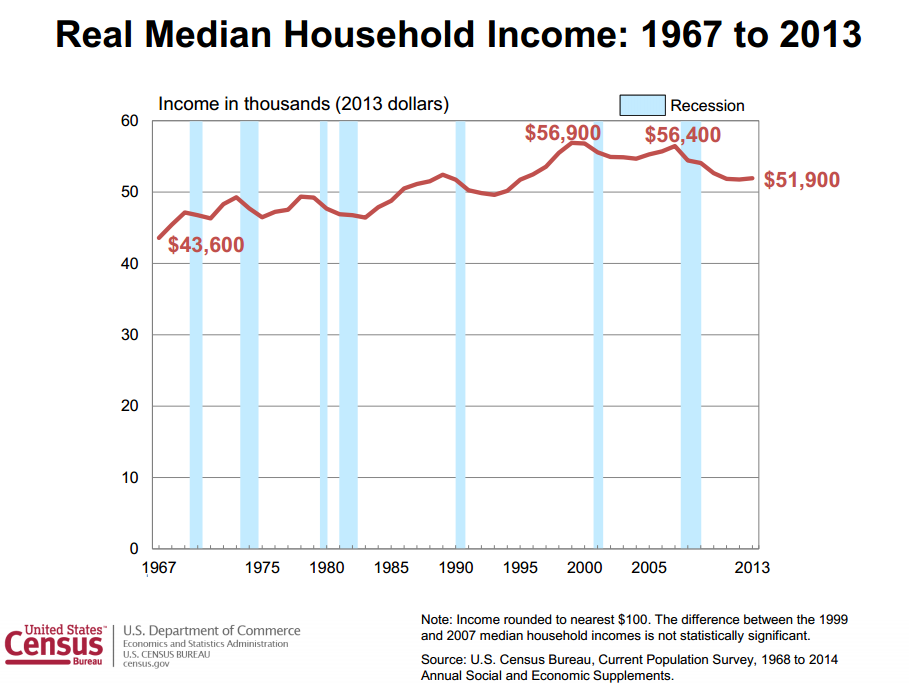
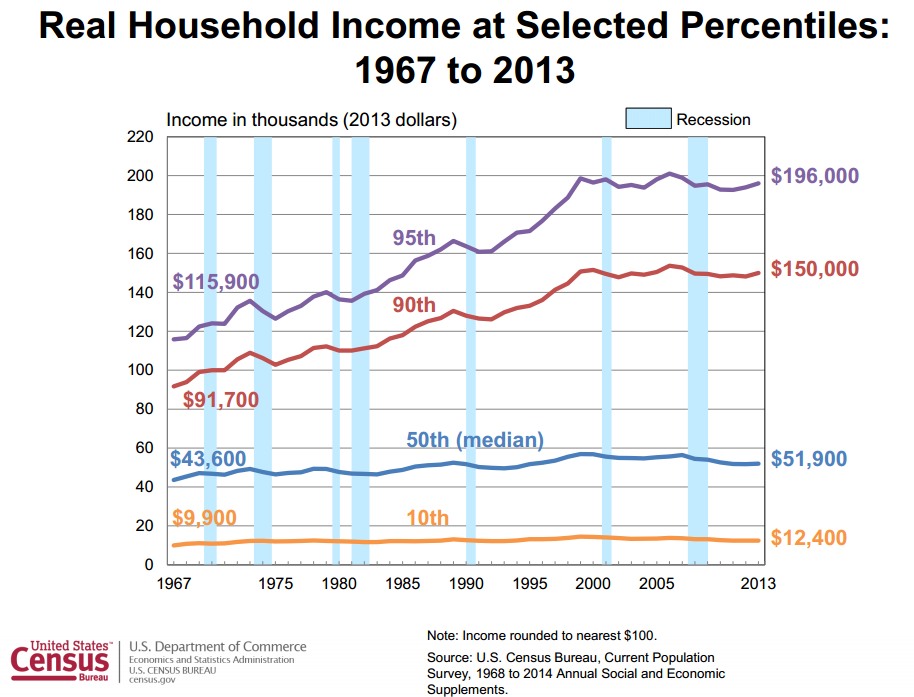
Yet in poll after poll, many Americans say they don’t think the recession ever ended, or that the economy has permanently changed for the worse. The two charts below, released today by the Census Bureau as part of its annual report on income, poverty and health insurance, go a long way toward explaining why. The real median household income last year was $51,939, about the same as in 2012 — and about 8 percent lower than it was in 2007. The recession began in December of that year.

Even at the 95th percentile, real income is stagnant since the early 2000s. When families that close to the very top of the pyramid see no growth over the course of a decade, there is no wonder that the polls consistently show Americans dissatisfied with the U.S. economy.

Top Read from The Fiscal Times:
- People Are Quitting Their Jobs. That’s Good News.
- The Threat That Could Scar the Economy for Decades
- How Extended Unemployment Myths Hurt Millions of Jobless Americans


