What a way to start the year.
Global markets came under serious pressure on Monday after Chinese stocks melted lower overnight. Traders in China reacted badly to poor December manufacturing data and currency volatility. They closed the day early with a 7 percent loss after triggering new circuit breaker rules that halted trading. In response, the Dow Jones Industrial Average lost more than 400 points at its lows to test the 17,000 level for the first time since October. The Dow ended the day off 276 points, or about 1.6 percent, and the S&P 500 fell 31 points, or 1.53 percent, to 2012.66.
Adding to the worries are new tensions between Iran and Saudi Arabia. Riyadh executed a well-known Shia cleric, which led to the burning of the Saudi embassy in Tehran. Saudi Arabia responded by cutting diplomatic ties.
Related: Here’s the Problem in China That’s Slamming US Stocks
As traders returned to work, a long list of concerns was waiting for them, including the specter of additional Federal Reserve interest rate hikes, falling corporate profitability, slowing U.S. economic data, crumbling energy prices and more. Remember this is also usually a time of seasonal strength — and that market history suggests that January performance will be indicative of what we should expect for the rest of the year.
This marks the end of the "Santa Claus rally." Historically, the period starting from Dec. 24 to Jan. 5 has featured an average S&P 500 gain of 1.5 percent. Failure to rally during this stretch tends to precede underperforming or bear market periods in the stock market, according to Jeffery Hirsch of the Stock Trader’s Almanac.
January provides an important signaling effect on what to expect for the rest of the year — “As January goes, so goes the year,” the old saying holds. The first month has served as a predictor of the full year 72.4 percent of the time, according to analyst Howard Silverblatt of S&P Dow Jones Indices.
The first day of the year hasn’t been as good a signal, with just a 50.6 percent record of accuracy.
Another barometer, Hirsch's "Early Warning System," looks at what stocks do during the first five days of the year and extrapolates that out through the rest of the year. In the last 16 presidential election years, 14 followed the direction of the first five days. And the full-month January performance has had a predictive record in 12 of the last 16 presidential election years.
Related: 14 Hot Stock Picks for 2016 from Top Newsletter Gurus
Weak fundamentals complicate the situation this year.
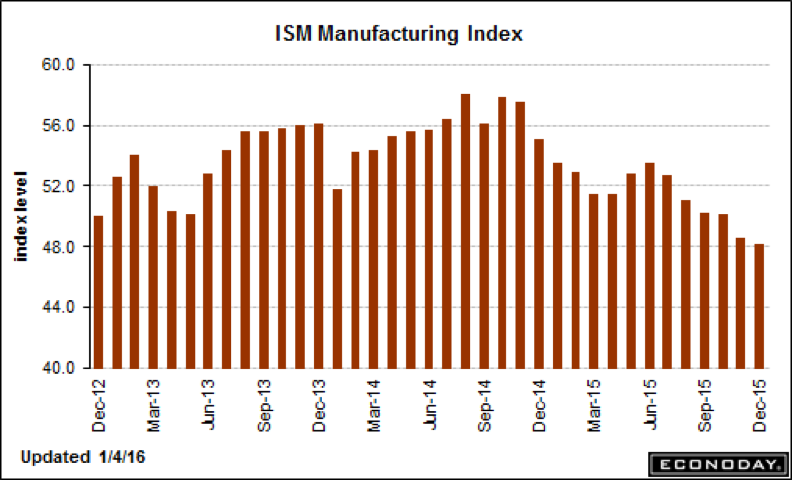
Consider that the U.S. ISM Manufacturing Activity Index collapsed in December to its weakest level since July 2009. At 48.2, it was much lower than the 49.2 consensus estimate and marks only the third time so far this cycle that activity contracted outright on a month-over-month basis (indicated by a sub-50 reading).

Yet signs of such weakness haven't stopped the Federal Reserve from maintaining a forecast for four more 0.25 percentage point interest rate hikes in 2016 after lifting rates in December for the first time since 2006.
Related: Why Oil Prices Will Rebound in 2016
That's about half the pace seen in the last few tightening cycles, but it's about twice as fast as the market wants to see. We'll learn more about where rates might go after the December payroll report is released on Friday, ahead of the next Fed policy announcement on Jan. 27.
Another hurdle is the approach of the Q4 earnings season, which will get its unofficial start on Jan. 11 when Alcoa (AA) reports. Things aren't looking good: According to FactSet data, the S&P 500 is on track for its third consecutive quarterly earnings decline, something that hasn't happened since the recession ended.
Earnings are expected to decline 4.7 percent in the quarter over the same period in 2014. This is a big markdown from the 0.6 percent drop expected at the end of September. Energy and material sector earnings are the big drag here. And with the OPEC vs. U.S. shale oil price war white hot, and inventory levels rising as storage fills up rapidly, a $20-a-barrel price wipeout is looking more and more likely.
Related: The 8 Worst-Performing Dow Stocks of 2015
On a technical basis, things are looking ugly as well. The Dow spent November and December trying to retake the 18,000 level last crossed back in July. Now, with 17,000 in play, a quick drop to the August-October lows near 16,000 is looking more and more likely.
Market breadth is weakening as fewer and fewer stocks stand against the tide: Just 52 percent of the S&P 500 stocks are in uptrends, down from a high of 72 percent in November and a high of nearly 85 percent back in the summer of 2014, before the crude oil wipeout slammed the energy sector.
If stocks falter now, the overwhelming weight of market history suggests investors are in for a rough ride through the rest of the year. Buckle up.


