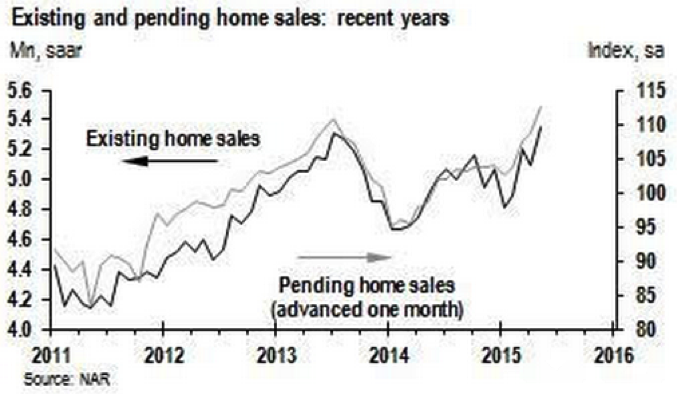
While everyone is distracted by the Greek debt drama, the U.S. housing market has quietly come back to life. On Monday, we learned existing home sales increased 5.1 percent in May, beating the consensus estimate for a 4.4 percent increase and climbing to a seasonally adjusted annual rate of 5.4 million.
This was the best showing since November 2009, when the post-recession surge from the homebuyer tax credit faded. First-time buyers, as a percentage of total sales, posted their highest share of purchases since late 2012. Surging demand and tight supply pushed prices up 7.9 percent over last year to a median of $228,700.
Related: Home Buying Gets Easier as Down Payments Dip
From the looks of things, the improvement is just getting started.

Ed Stansfield, Capital Economics' property economist, highlighted tailwinds including strong jobs growth and looser credit conditions in a note to clients. These positives have been more than enough to offset any adverse impact from the recent backup in mortgage rates. More is coming as the index of pending sales recently increased to a nine-year high.
J.P. Morgan economist Daniel Silver points to another dynamic in play: A big drop in the share of sales from distressed properties such as foreclosures. From peaks of 50 percent in 2009 and 40 percent in 2011, the share of sales going to these bargain bin homes is running at around just 10 percent. That's helping keep the pressure off of nicer, occupied offerings with owner equity.
Related: How to Get the Most for Your Home Improvement Money
There's more.
Silver's colleague Robert Mellman notes that new housing supply is apt to lag a rebound in the household formation rate driven by millennials finally starting to move out on their own after a long post-recession stretch of shacking up with others. This will put further upward pressure on rental rates amid low vacancy levels, and it will further lift purchase prices because of the buy-vs.-rent connection.
Specifically, during the first five years of this economic expansion, growth in household formation averaged less than 0.5 percent per year — the slowest five-year period in the history of the data series going back to the 1950s and less than half the level seen during the housing bubble. As the job market has improved, household formation grew at a 1.3 percent annual rate in the first quarter — pointing to an increase in total housing unit demand of more than 1 million units over the next year.
On the supply side, Mellman estimates total new construction of 1.2 million units. But that will be reduced by the number of homes demolished, which totaled 491,000 in 2014. So figure net new housing supply of around 800,000, with supply not catching up to demand until sometime after 2017.
In other words: It's a seller's market and will remain so for the foreseeable future.
Related: Why the Housing Market Is About to Perk Up
But buyers have a few positives to look at as well. For trade-up buyers, the share of folks suffering from negative home equity has halved, from more than 24 percent in late 2011 to less than 12 percent now. For new buyers, lending standards are finally starting to loosen just as the Federal Housing Administration (FHA) is set to lower the cost of mortgage insurance from 1.35 percent to 0.85 percent. Also, late last year Fannie Mae and Freddie Mac announced that they were reintroducing mortgages allowing buyers to put just 3 percent down.

Investors are betting the turnaround continues. Lumber futures, a leading indicator of the health of the housing market, bottomed in May after falling nearly 42 percent from their 2013 highs. Prices are already up nearly 30 percent, returning to levels last seen in February.
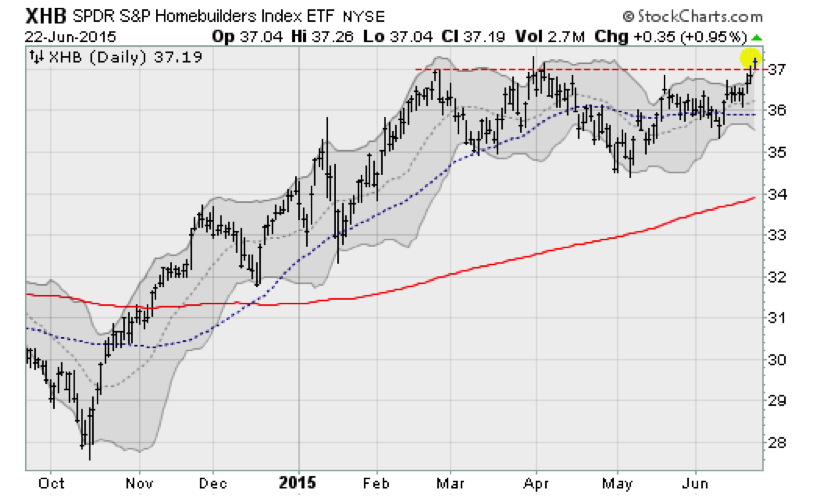
Housing stocks, as represented by the S&P Homebuilders SPDR ETF (XHB), have climbed out of a trading range going back to February and jumped to a new post-recession high on Monday.
Top Reads from The Fiscal Times:


