You Won’t Believe How Much Diabetes is Costing the U.S.
The budget-busting price of Sovaldi, a drug used to treat hepatitis C has generated wave after wave of media attention, but it’s far from the only drug creating cost problems for patients and insurers.
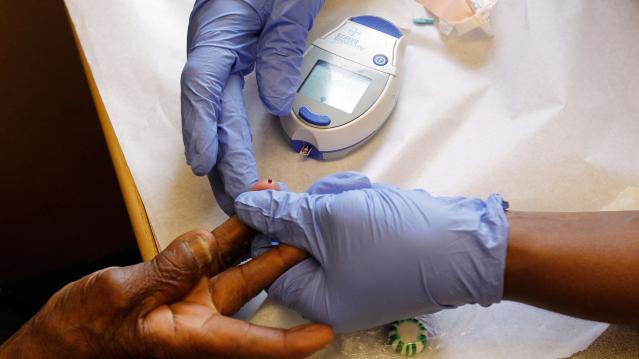
As Michelle Andrews of Kaiser Health News points out, diabetes affects 29 million Americans, or 10 times as many people as hepatitis C, and the costs of treating it have been rising quickly. And because it’s a chronic condition, people require lifetime care.
Related: Diabetes Detection Up in Pro-Obamacare States
In 2011, the average annual health spending for individuals with diabetes was $14,093. Two years later, it had risen to $14,999, according to the Healthcare Cost Institute. In contrast, a person without diabetes spent about $10,000 less in medical costs in 2013. Pharmacy provider Express Scripts said earlier this year that 2014 marked the fourth year in a row that medication used to treat diabetes were the most expensive of any traditional drug class.
In all, diabetes costs totaled an estimated $245 billion in 2012, including both direct medical expenses and indirect costs from disability and lost work productivity.
While some of the most popular diabetes drugs aren’t particularly expensive, the new brand-name drugs that are continually being introduced offer more effective treatment and fewer side effects — but also come with a higher price tag. Less than half of the diabetes prescription treatments filled in 2014 were generic.
Nearly a century after its discovery in 1921, insulin is still a common form of treatment for the millions of people with type 1 diabetes, yet there is still no generic form available. Patent protection has been extended in some cases due to improvements in existing formulations. Once those patents expire, Andrews notes, biologically similar drugs could replace them and reduce the price by up to 40 percent.
Related: This Disease Hikes Health Care Costs By More than $10,000 a Year
The financial ramifications of diabetes don’t just stem from the cost of drugs or medical treatment — it’s also been proven that people with diabetes have a high-school dropout rate that is six percentage points higher than those without the disease, according to a Health Affairs study. In addition, young adults with diabetes are four to six percentage points less likely to attend college than those without the disease.
Diabetes also contributes to lower employment and wages. On average, a person with diabetes earns $160,000 less over the course of their lives than people who don’t develop the disease. By age 30, a person with diabetes is 10 percent less likely to be employed.
So even if it’s not generating as many headlines as hepatitis C at any given point in time, the costs of diabetes can’t be ignored.
Top Reads From The Fiscal Times
- The 10 Worst States for Property Taxes
- Two-Thirds of Americans Believe Social Security Is in a Crisis State
- Why McDonald’s Could Suddenly Be Responsible for Millions of New Employees
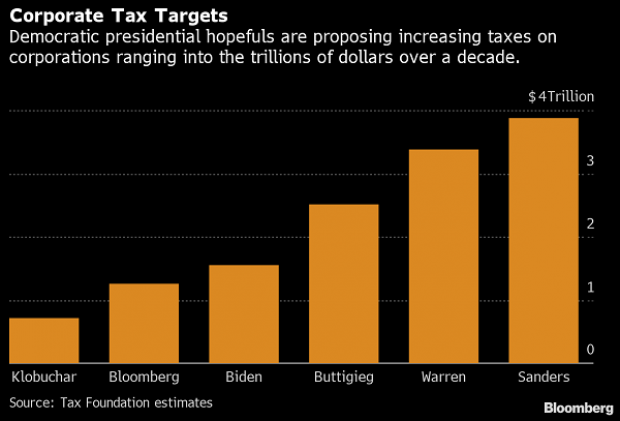
Chart of the Day: Boosting Corporate Tax Revenues
The leading candidates for the Democratic presidential nomination have all proposed increasing taxes on corporations, including raising income tax rates to levels ranging from 25% to 35%, up from the current 21% imposed by the Republican tax cuts in 2017. With Bernie Sanders leading the way at $3.9 trillion, here’s how much revenue the higher proposed corporate taxes, along with additional proposed surtaxes and reduced tax breaks, would generate over a decade, according to calculations by the right-leaning Tax Foundation, highlighted Wednesday by Bloomberg News.
Chart of the Day: Discretionary Spending Droops
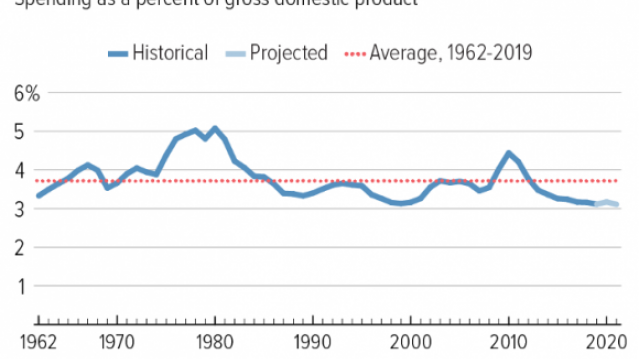
The federal government’s total non-defense discretionary spending – which covers everything from education and national parks to veterans’ medical care and low-income housing assistance – equals 3.2% of GDP in 2020, near historic lows going back to 1962, according to an analysis this week from the Center on Budget and Policy Priorities.
Chart of the Week: Trump Adds $4.7 Trillion in Debt
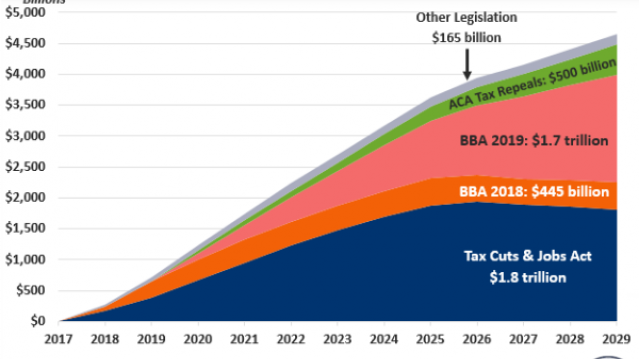
The Committee for a Responsible Federal Budget estimated this week that President Trump has now signed legislation that will add a total of $4.7 trillion to the national debt between 2017 and 2029. Tax cuts and spending increases account for similar portions of the projected increase, though if the individual tax cuts in the 2017 Republican overhaul are extended beyond their current expiration date at the end of 2025, they would add another $1 trillion in debt through 2029.
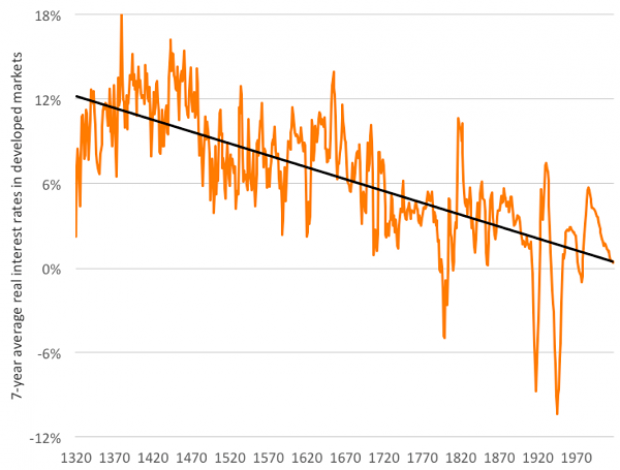
Chart of the Day: The Long Decline in Interest Rates

Are interest rates destined to move higher, increasing the cost of private and public debt? While many experts believe that higher rates are all but inevitable, historian Paul Schmelzing argues that today’s low-interest environment is consistent with a long-term trend stretching back 600 years.
The chart “shows a clear historical downtrend, with rates falling about 1% every 60 years to near zero today,” says Bloomberg’s Aaron Brown. “Rates do tend to revert to a mean, but that mean seems to be declining.”
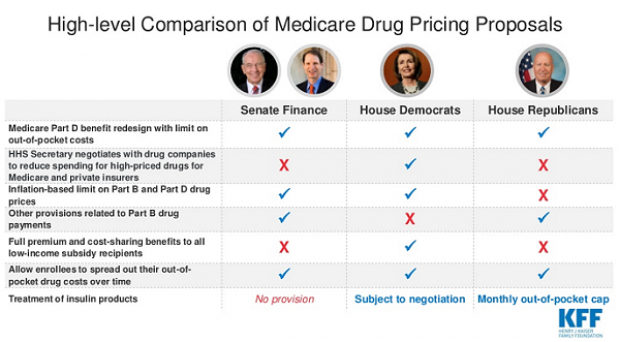
Chart of the Day: Drug Price Plans Compared
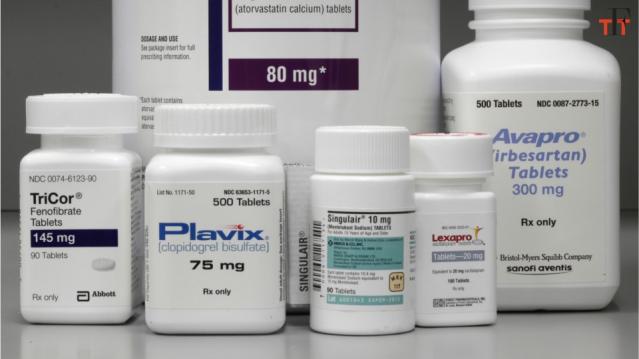
Lawmakers are considering three separate bills that are intended to reduce the cost of prescription drugs. Here’s an overview of the proposals, from a series of charts produced by the Kaiser Family Foundation this week. An interesting detail highlighted in another chart: 88% of voters – including 92% of Democrats and 85% of Republicans – want to give the government the power to negotiate prices with drug companies.

