The Shocking Secret About How Your Car Insurance Rate Gets Set

Most drivers probably know that if they get into an accident, their insurance rates are also likely to take a hit. But a new analysis by Consumer Reports finds that your car insurance premiums are increasingly based on factors such as your credit score that are unrelated to your driving record.
How well you drive may actually have little connection to how much you pay for insurance, the consumer group found.
In a two-year investigation, Consumer Reports analyzed more than 2 billion insurance price quotes obtained from more than 700 insurers across the country. It found that in many states a bad credit history will drive up your insurance premiums more than a drunk driving conviction.
“What we found is that behind the rate quotes is a pricing process that judges you less on driving habits and increasingly on socioeconomic factors,” the consumer organization reports. “These include your credit history, whether you use department-store or bank credit cards, and even your TV provider. Those measures are then used in confidential and often confounding scoring algorithms.”
Consumer Reports says it found that most car insurance companies use about 30 elements of the nearly 130 available in a credit report to construct their own secret score for policyholders, and that credit scores could have more of an impact on premiums than any other factor. Drivers with the best credit scores were charged up to $526 less than similar drivers with only “good” scores, depending on where they lived. Only three states — California, Hawaii and Massachusetts — prohibit insurers from factoring in credit scores when setting prices.
Drivers are legally required to carry car insurance, but the lack of pricing transparency makes it harder for them to make informed decisions about which policy to buy. “Because insurance companies are under no obligation to tell you what score they have cooked up for you, you have no idea whether you have a halo over your head or a bull’s-eye on your back for a price increase,” Consumer Reports says.
Industry advertising that promotes special discounts, such as for bundling home and car insurance, only muddles the purchasing process because those special deals don’t actually save people much money, Consumer Reports found.
The organization says it’s high time for truth in car insurance, and it’s asking consumers to sign a petition demanding that insurers -- and the state regulators who oversee them -- use price-setting practices that are tied to more meaningful factors, like driving records. It is also asking consumers to tweet the National Association of Insurance Commissioners, @NAIC_News, and tell them to “Price me by how I drive, not by who you think I am! #FixCarInsurance.”
For more information on state-by-state insurance premiums, or to sign the Consumer Reports petition, go to ConsumerReports.org/FixCarinsurance.
Top Reads From The Fiscal Times:
- Americans Are About to Get a Nice Fat Pay Raise
- How Millenials Could Damage the U.S. Economy
- The Pain the Job Numbers Don’t Show
Tax Refunds Rebound
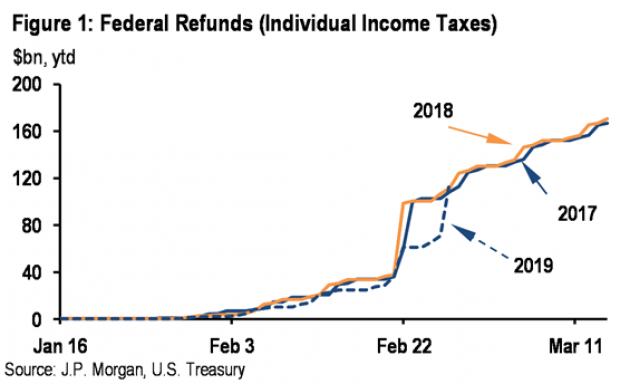
Smaller refunds in the first few weeks of the current tax season were shaping up to be a political problem for Republicans, but new data from the IRS shows that the value of refund checks has snapped back and is now running 1.3 percent higher than last year. The average refund through February 23 last year was $3,103, while the average refund through February 22 of 2019 was $3,143 – a difference of $40. The chart below from J.P. Morgan shows how refunds performed over the last 3 years.
Number of the Day: $22 Trillion
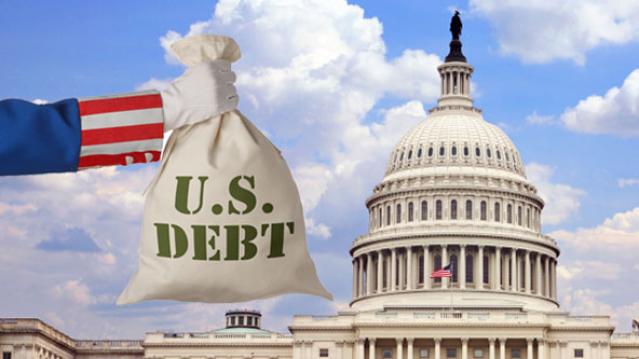
The total national debt surpassed $22 trillion on Monday. Total public debt outstanding reached $22,012,840,891,685.32, to be exact. That figure is up by more than $1.3 trillion over the past 12 months and by more than $2 trillion since President Trump took office.
Chart of the Week: The Soaring Cost of Insulin
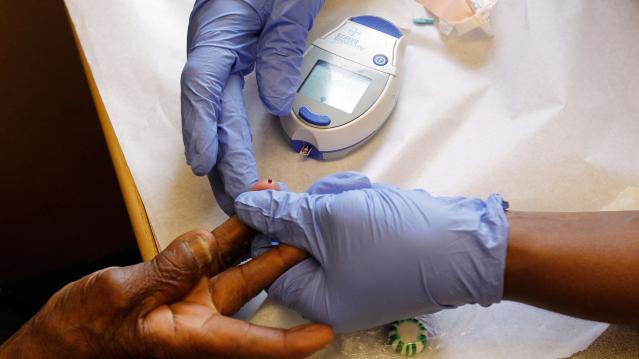
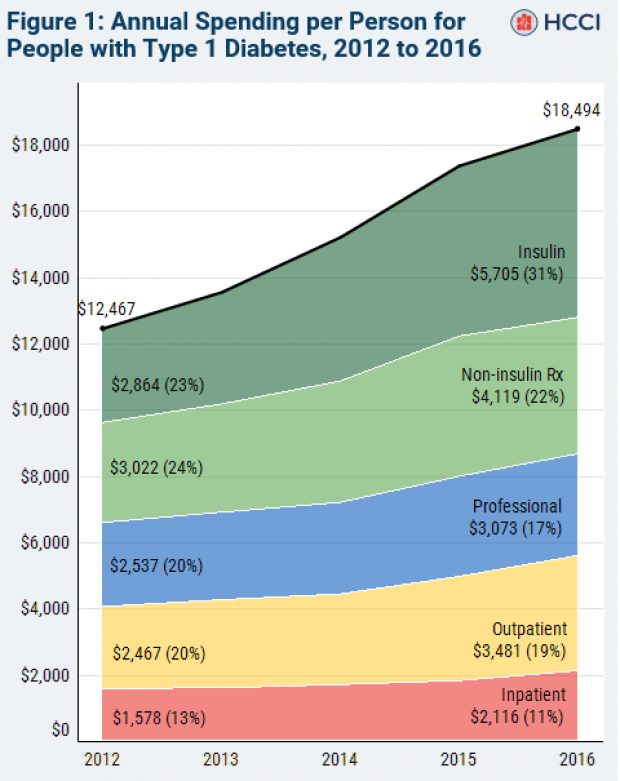
The cost of insulin used to treat Type 1 diabetes nearly doubled between 2012 and 2016, according to an analysis released this week by the Health Care Cost Institute. Researchers found that the average point-of-sale price increased “from $7.80 a day in 2012 to $15 a day in 2016 for someone using an average amount of insulin (60 units per day).” Annual spending per person on insulin rose from $2,864 to $5,705 over the five-year period. And by 2016, insulin costs accounted for nearly a third of all heath care spending for those with Type 1 diabetes (see the chart below), which rose from $12,467 in 2012 to $18,494.
Chart of the Day: Shutdown Hits Like a Hurricane

The partial government shutdown has hit the economy like a hurricane – and not just metaphorically. Analysts at the Committee for a Responsible Federal Budget said Tuesday that the shutdown has now cost the economy about $26 billion, close to the average cost of $27 billion per hurricane calculated by the Congressional Budget Office for storms striking the U.S. between 2000 and 2015. From an economic point of view, it’s basically “a self-imposed natural disaster,” CRFB said.
Chart of the Week: Lowering Medicare Drug Prices

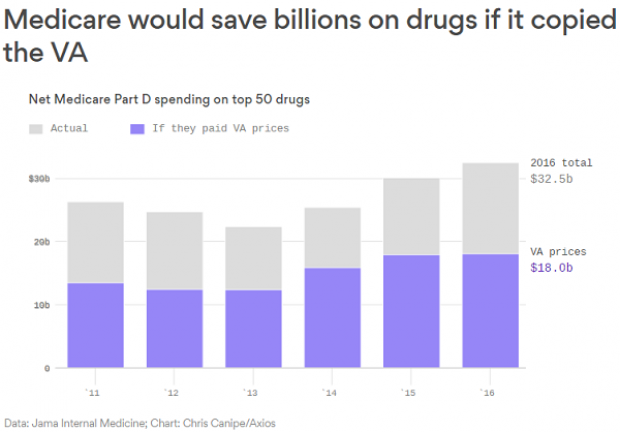
The U.S. could save billions of dollars a year if Medicare were empowered to negotiate drug prices directly with pharmaceutical companies, according to a paper published by JAMA Internal Medicine earlier this week. Researchers compared the prices of the top 50 oral drugs in Medicare Part D to the prices for the same drugs at the Department of Veterans Affairs, which negotiates its own prices and uses a national formulary. They found that Medicare’s total spending was much higher than it would have been with VA pricing.
In 2016, for example, Medicare Part D spent $32.5 billion on the top 50 drugs but would have spent $18 billion if VA prices were in effect – or roughly 45 percent less. And the savings would likely be larger still, Axios’s Bob Herman said, since the study did not consider high-cost injectable drugs such as insulin.

