Here’s Why Americans Are Keeping Their Cars Longer than Ever
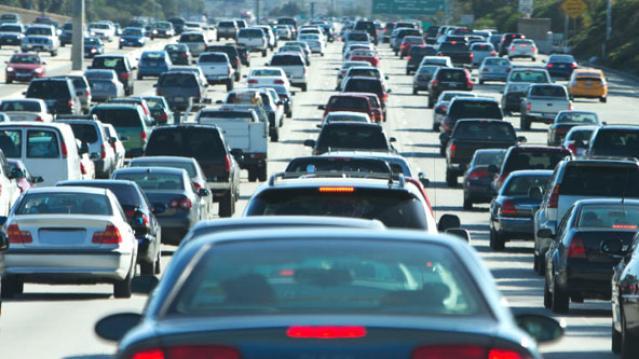
As cars get more reliable Americans are holding onto their vehicles for longer than ever before. The average age of cars and light trucks is now 11.5 years old, according to a new report from IHS Automotive.
In addition to better reliability, cars are getting older because Americans bought far fewer new cars in the years following the Great Recession, as concerns lingered about unemployment and the strength of the economy.
Even as consumers have started purchasing new vehicles again, they’re still holding onto their older ones. The average length of ownership of a new vehicle reached 6.5 years in the first quarter of 2015, more than two years longer than in 2006. The number of cars more than 12 years old continues to grow and is expected to increase 15 percent by 2020.
Related: The Incredible Disappearing American-Made Car
IHS predicts that the average age of vehicles will inch up slightly over the next few years, hitting 11.7 years in 2018.
The number of cars on the road hit a record 258 million, posting a 2.1 percent increase over last year, driven by the purchase of new cars. IHS expects that volume of cars less than 5 years old will increase by 24 percent over the next five years.
Consumer sales of autos were on pace to rise 4.2 percent this month, according to TrueCar, compared to July of 2014, thanks to increased demand, summer sales events and the growing popularity of premium brands.
Top Reads from The Fiscal Times:
- Why Hillary Clinton’s Tax Plan to Soak Investors Won’t Work
- US Health Spending: $3.1 Trillion a Year and Growing
- Joe Biden: The Looming Threat to a Republican Presidency
Tax Refunds Rebound

Smaller refunds in the first few weeks of the current tax season were shaping up to be a political problem for Republicans, but new data from the IRS shows that the value of refund checks has snapped back and is now running 1.3 percent higher than last year. The average refund through February 23 last year was $3,103, while the average refund through February 22 of 2019 was $3,143 – a difference of $40. The chart below from J.P. Morgan shows how refunds performed over the last 3 years.

Number of the Day: $22 Trillion

The total national debt surpassed $22 trillion on Monday. Total public debt outstanding reached $22,012,840,891,685.32, to be exact. That figure is up by more than $1.3 trillion over the past 12 months and by more than $2 trillion since President Trump took office.
Chart of the Week: The Soaring Cost of Insulin

The cost of insulin used to treat Type 1 diabetes nearly doubled between 2012 and 2016, according to an analysis released this week by the Health Care Cost Institute. Researchers found that the average point-of-sale price increased “from $7.80 a day in 2012 to $15 a day in 2016 for someone using an average amount of insulin (60 units per day).” Annual spending per person on insulin rose from $2,864 to $5,705 over the five-year period. And by 2016, insulin costs accounted for nearly a third of all heath care spending for those with Type 1 diabetes (see the chart below), which rose from $12,467 in 2012 to $18,494.

Chart of the Day: Shutdown Hits Like a Hurricane

The partial government shutdown has hit the economy like a hurricane – and not just metaphorically. Analysts at the Committee for a Responsible Federal Budget said Tuesday that the shutdown has now cost the economy about $26 billion, close to the average cost of $27 billion per hurricane calculated by the Congressional Budget Office for storms striking the U.S. between 2000 and 2015. From an economic point of view, it’s basically “a self-imposed natural disaster,” CRFB said.

Chart of the Week: Lowering Medicare Drug Prices

The U.S. could save billions of dollars a year if Medicare were empowered to negotiate drug prices directly with pharmaceutical companies, according to a paper published by JAMA Internal Medicine earlier this week. Researchers compared the prices of the top 50 oral drugs in Medicare Part D to the prices for the same drugs at the Department of Veterans Affairs, which negotiates its own prices and uses a national formulary. They found that Medicare’s total spending was much higher than it would have been with VA pricing.
In 2016, for example, Medicare Part D spent $32.5 billion on the top 50 drugs but would have spent $18 billion if VA prices were in effect – or roughly 45 percent less. And the savings would likely be larger still, Axios’s Bob Herman said, since the study did not consider high-cost injectable drugs such as insulin.
