Here’s a Good Sign for the Economy: Americans Are Hitting the Road

Driving is as American as apple pie, but the Great Recession took a big bite out of the nation’s driving habits. Total miles driven in the U.S. hit a peak in the fall of 2007 just before the recession hit and fell for several years after. Total miles driven bottomed out in 2011, moving slowly higher since then.
The Department of Transportation reported this week that total miles driven has hit a new, all-time high. Vehicles drove 7.3 billion miles in May, up 2.7 percent from May, 2014. The annual number is even more impressive: Using a moving 12-month figure, total miles traveled in the past year registers at 3.08 trillion miles. This graph from Calculated Risk paints the picture:
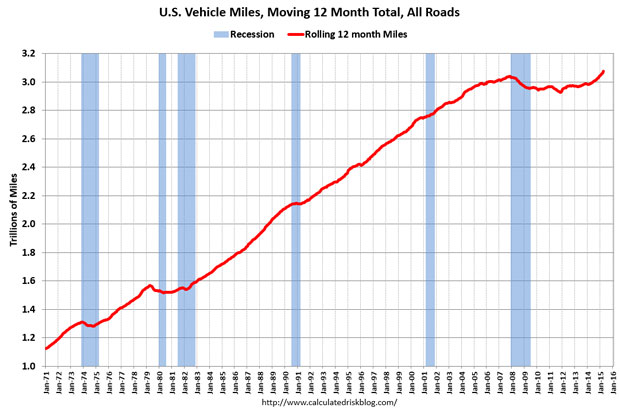
This sure seems like good news for the U.S. economy. The data for miles driven reflects booms and busts in the economy, and seeing the numbers climb suggests the economy is still gaining strength.
However, the raw numbers may not be quite as good as they first appear. Even though miles driven are up, so is the U.S. population. Once the data is adjusted for population growth, a less robust picture emerges. Doug Short at Advisor Perspectives ran the numbers, concluding that on a per capita basis, miles driven is still well below its pre-recession peak. Here’s his chart:
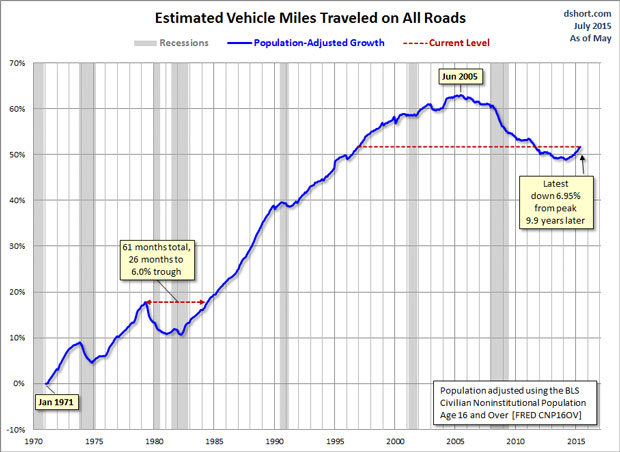
It looks like the U.S. economy still has a long way to go to get back to its pre-recession strength, at least as measured by by the rough proxy of total miles driven.
Tax Refunds Rebound

Smaller refunds in the first few weeks of the current tax season were shaping up to be a political problem for Republicans, but new data from the IRS shows that the value of refund checks has snapped back and is now running 1.3 percent higher than last year. The average refund through February 23 last year was $3,103, while the average refund through February 22 of 2019 was $3,143 – a difference of $40. The chart below from J.P. Morgan shows how refunds performed over the last 3 years.

Number of the Day: $22 Trillion

The total national debt surpassed $22 trillion on Monday. Total public debt outstanding reached $22,012,840,891,685.32, to be exact. That figure is up by more than $1.3 trillion over the past 12 months and by more than $2 trillion since President Trump took office.
Chart of the Week: The Soaring Cost of Insulin

The cost of insulin used to treat Type 1 diabetes nearly doubled between 2012 and 2016, according to an analysis released this week by the Health Care Cost Institute. Researchers found that the average point-of-sale price increased “from $7.80 a day in 2012 to $15 a day in 2016 for someone using an average amount of insulin (60 units per day).” Annual spending per person on insulin rose from $2,864 to $5,705 over the five-year period. And by 2016, insulin costs accounted for nearly a third of all heath care spending for those with Type 1 diabetes (see the chart below), which rose from $12,467 in 2012 to $18,494.

Chart of the Day: Shutdown Hits Like a Hurricane

The partial government shutdown has hit the economy like a hurricane – and not just metaphorically. Analysts at the Committee for a Responsible Federal Budget said Tuesday that the shutdown has now cost the economy about $26 billion, close to the average cost of $27 billion per hurricane calculated by the Congressional Budget Office for storms striking the U.S. between 2000 and 2015. From an economic point of view, it’s basically “a self-imposed natural disaster,” CRFB said.

Chart of the Week: Lowering Medicare Drug Prices

The U.S. could save billions of dollars a year if Medicare were empowered to negotiate drug prices directly with pharmaceutical companies, according to a paper published by JAMA Internal Medicine earlier this week. Researchers compared the prices of the top 50 oral drugs in Medicare Part D to the prices for the same drugs at the Department of Veterans Affairs, which negotiates its own prices and uses a national formulary. They found that Medicare’s total spending was much higher than it would have been with VA pricing.
In 2016, for example, Medicare Part D spent $32.5 billion on the top 50 drugs but would have spent $18 billion if VA prices were in effect – or roughly 45 percent less. And the savings would likely be larger still, Axios’s Bob Herman said, since the study did not consider high-cost injectable drugs such as insulin.
