Will Parents Finally Get a Break on Back-to-School Spending This Year?
The average family with school-age children will spend $630 on clothing and school supplies before their kids return to the classroom.
That’s down slightly from the $669 spent last year, but represents a 42 percent increase over the past decade, according to the National Retail Federation.
Despite the lower per-family spending, fewer consumers say the economy has influenced their spending plans, and a smaller percentage are looking for sales or buying generic products to save.
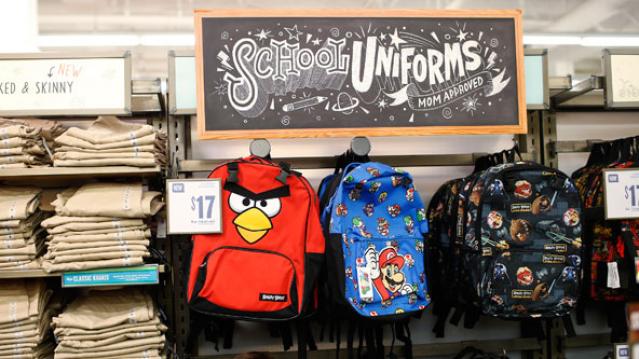
Among those surveyed, 93 percent said they’d buy clothing for their kids, laying out an average $218 on new threads and $117 on new shoes. Spending on school supplies will average $98.
Families said they planned to spend an average of $197 on electronics, down from $212 spent in that category last year.
Related: 10 Sure Ways to Save on Back-to-School Shopping
A quarter of those surveyed said that they’d start back-to-school shopping just a week or two before school started, while one in five start shopping two months before school begins.
Discount stores represented the most popular destinations for online shopping (62 percent), followed by department stores (56 percent), and clothing stores (54 percent).
Parents are letting their kids take the lead on some purchases, with 86 percent of shoppers saying that their kids will influence at least a quarter of purchases. Teens will spend $33 of their own money an average, and pre-teens will pay $18 out of pocket.
Total spending on back-to-school shopping will amount to $25 billion for K-12, with another $43 billion spent on back-to-college shopping.
Coming Soon: Deductible Relief Day!

You may be familiar with the concept of Tax Freedom Day – the date on which you have earned enough to pay all of your taxes for the year. Focusing on a different kind of financial burden, analysts at the Kaiser Family Foundation have created Deductible Relief Day – the date on which people in employer-sponsored insurance plans have spent enough on health care to meet the average annual deductible.
Average deductibles have more than tripled over the last decade, forcing people to spend more out of pocket each year. As a result, Deductible Relief Day is “getting later and later in the year,” Kaiser’s Larry Levitt said in a tweet Thursday.

Chart of the Day: Families Still Struggling

Ten years into what will soon be the longest economic expansion in U.S. history, 40% of families say they are still struggling, according to a new report from the Urban Institute. “Nearly 4 in 10 nonelderly adults reported that in 2018, their families experienced material hardship—defined as trouble paying or being unable to pay for housing, utilities, food, or medical care at some point during the year—which was not significantly different from the share reporting these difficulties for the previous year,” the report says. “Among adults in families with incomes below twice the federal poverty level (FPL), over 60 percent reported at least one type of material hardship in 2018.”

Chart of the Day: Pragmatism on a Public Option

A recent Morning Consult poll 3,073 U.S. adults who say they support Medicare for All shows that they are just as likely to back a public option that would allow Americans to buy into Medicare or Medicaid without eliminating private health insurance. “The data suggests that, in spite of the fervor for expanding health coverage, a majority of Medicare for All supporters, like all Americans, are leaning into their pragmatism in response to the current political climate — one which has left many skeptical that Capitol Hill can jolt into action on an ambitious proposal like Medicare for All quickly enough to wrangle the soaring costs of health care,” Morning Consult said.

Chart of the Day: The Explosive Growth of the EITC

The Earned Income Tax Credit, a refundable tax credit for low- to moderate-income workers, was established in 1975, with nominal claims of about $1.2 billion ($5.6 billion in 2016 dollars) in its first year. According to the Tax Policy Center, by 2016 “the total was $66.7 billion, almost 12 times larger in real terms.”

Chart of the Day: The Big Picture on Health Care Costs

“The health care services that rack up the highest out-of-pocket costs for patients aren't the same ones that cost the most to the health care system overall,” says Axios’s Caitlin Owens. That may distort our view of how the system works and how best to fix it. For example, Americans spend more out-of-pocket on dental services ($53 billion) than they do on hospital care ($34 billion), but the latter is a much larger part of national health care spending as a whole.
