Corporate Sponsors Pass on Women's World Cup Ticker-Tape Parade
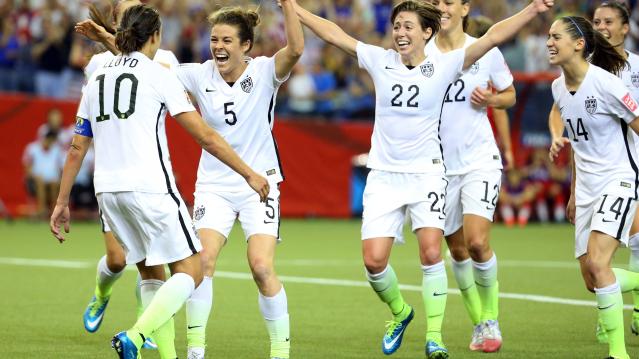
While the country celebrates the U.S. Women’s Soccer team’s World Cup Championship with a New York City ticker tape parade, corporations have been reluctant to pony up cash to cover the $2 million celebration.
Major League Soccer, Nike, fod company Mondelez and video game giant Electronic Arts have contributed a total $450,000 toward the parade, leaving New York City to cover the difference, the New York Post reports. That includes the cost of cleanup and security.
By contrast, the 2012 parade that celebrated the New York Giants winning the Super Bowl had more than a dozen corporate sponsors.
Related: For World Cup Hero Carli Lloyd, 16 Minutes Can Mean Millions
City officials told the Post that the dearth of sponsors reflected the short period of time in which the city pulled together plans for the parade. The team is the first women’s squad to receive a New York City ticker tape parade, although the city has honored individual women, such as Olympic athletes and Amelia Earhart.
More than 12,000 people entered a lottery for tickets to the parade, which will feature the team atop patriotic floats moving down the Canyon of Heroes in lower Manhattan as spectators throw confetti from surrounding buildings.
While companies may not have shown much interest in the parade, they are clearly interested in star Carli Lloyd. Her agent has repeatedly received more than 200 inquiries from marketers who want to work with the athlete.
That’s good news for Lloyd, who like all other National Women’s Soccer League players, is subject to a $37,800 salary cap, about one 10th of what the average male Major League Soccer player makes in a year.
Chart of the Day: Boosting Corporate Tax Revenues

The leading candidates for the Democratic presidential nomination have all proposed increasing taxes on corporations, including raising income tax rates to levels ranging from 25% to 35%, up from the current 21% imposed by the Republican tax cuts in 2017. With Bernie Sanders leading the way at $3.9 trillion, here’s how much revenue the higher proposed corporate taxes, along with additional proposed surtaxes and reduced tax breaks, would generate over a decade, according to calculations by the right-leaning Tax Foundation, highlighted Wednesday by Bloomberg News.

Chart of the Day: Discretionary Spending Droops

The federal government’s total non-defense discretionary spending – which covers everything from education and national parks to veterans’ medical care and low-income housing assistance – equals 3.2% of GDP in 2020, near historic lows going back to 1962, according to an analysis this week from the Center on Budget and Policy Priorities.
Chart of the Week: Trump Adds $4.7 Trillion in Debt

The Committee for a Responsible Federal Budget estimated this week that President Trump has now signed legislation that will add a total of $4.7 trillion to the national debt between 2017 and 2029. Tax cuts and spending increases account for similar portions of the projected increase, though if the individual tax cuts in the 2017 Republican overhaul are extended beyond their current expiration date at the end of 2025, they would add another $1 trillion in debt through 2029.
Chart of the Day: The Long Decline in Interest Rates

Are interest rates destined to move higher, increasing the cost of private and public debt? While many experts believe that higher rates are all but inevitable, historian Paul Schmelzing argues that today’s low-interest environment is consistent with a long-term trend stretching back 600 years.
The chart “shows a clear historical downtrend, with rates falling about 1% every 60 years to near zero today,” says Bloomberg’s Aaron Brown. “Rates do tend to revert to a mean, but that mean seems to be declining.”

Chart of the Day: Drug Price Plans Compared

Lawmakers are considering three separate bills that are intended to reduce the cost of prescription drugs. Here’s an overview of the proposals, from a series of charts produced by the Kaiser Family Foundation this week. An interesting detail highlighted in another chart: 88% of voters – including 92% of Democrats and 85% of Republicans – want to give the government the power to negotiate prices with drug companies.
