It’s Not Just in Your Head, the Web Is Slowing Down

It’s not your imagination, and it’s not because AT&T — and possibly others — is purposefully cutting speeds to unlimited data plan users. The Internet is slowing down. The reason: Websites are growing in size, causing slower load times.
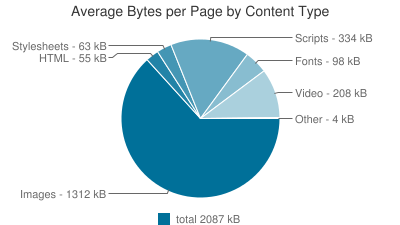
The average website is now 2.1 MB in size, compared to 1.5 MB two years ago, according to HTTP Archive, an Internet data measurement company. Multiple reasons can explain this increase in size.
Sites have been adding more content in an effort to drum up traffic, such as videos, engaging images, interactive plug-ins (comments and feeds) and other code and script-heavy features. Websites are becoming more and more technically advanced, and other sites have to keep adding features to stay competitive.
To keep up with the rapidly increasing number of users accessing sites on various platforms, developers are offering more versions of websites as well as apps to accommodate all devices, including smartphones, watches, tablets, and other gadgets. All of these versions require additional code, ultimately adding to the weight of a given website.
Then there are the advertisers who want to get the user’s attention by creating dramatic displays for their products that consume even more bandwidth.
Websites also want to know who is visiting their pages, both welcome and unwelcome visitors. New tools that track and analyze visitors have increased in popularity, as well as stronger encryption technology to add more security. These security measures and trackers require more code, again slowing load times.
Unfortunately for websites trying to keep up with the times, Google has just introduced a new ‘Slow to Load’ warning sign in mobile search results. Since mobile searches account for more than half of the total Google searches in 10 countries, Google wants to enhance user experience for those on their mobile platform.
Although the weight of a website isn’t all that contributes to slow loading, it’s a major factor. Other reasons include users overusing data, a poor connection, or a high level of traffic in the mobile network.
Google also changed its algorithm in April, so now ‘mobile friendly’ sites are ranked higher on search results, while those that fail to meet its criteria are ranked lower.
Although the internet is only slowing by a matter of seconds, it’s still slowing down. All the more reason for a user to become frustrated with a page that’s taking a couple extra seconds to load and go to a competitor’s site.
Chart of the Day: Boosting Corporate Tax Revenues

The leading candidates for the Democratic presidential nomination have all proposed increasing taxes on corporations, including raising income tax rates to levels ranging from 25% to 35%, up from the current 21% imposed by the Republican tax cuts in 2017. With Bernie Sanders leading the way at $3.9 trillion, here’s how much revenue the higher proposed corporate taxes, along with additional proposed surtaxes and reduced tax breaks, would generate over a decade, according to calculations by the right-leaning Tax Foundation, highlighted Wednesday by Bloomberg News.

Chart of the Day: Discretionary Spending Droops

The federal government’s total non-defense discretionary spending – which covers everything from education and national parks to veterans’ medical care and low-income housing assistance – equals 3.2% of GDP in 2020, near historic lows going back to 1962, according to an analysis this week from the Center on Budget and Policy Priorities.
Chart of the Week: Trump Adds $4.7 Trillion in Debt

The Committee for a Responsible Federal Budget estimated this week that President Trump has now signed legislation that will add a total of $4.7 trillion to the national debt between 2017 and 2029. Tax cuts and spending increases account for similar portions of the projected increase, though if the individual tax cuts in the 2017 Republican overhaul are extended beyond their current expiration date at the end of 2025, they would add another $1 trillion in debt through 2029.
Chart of the Day: The Long Decline in Interest Rates

Are interest rates destined to move higher, increasing the cost of private and public debt? While many experts believe that higher rates are all but inevitable, historian Paul Schmelzing argues that today’s low-interest environment is consistent with a long-term trend stretching back 600 years.
The chart “shows a clear historical downtrend, with rates falling about 1% every 60 years to near zero today,” says Bloomberg’s Aaron Brown. “Rates do tend to revert to a mean, but that mean seems to be declining.”

Chart of the Day: Drug Price Plans Compared

Lawmakers are considering three separate bills that are intended to reduce the cost of prescription drugs. Here’s an overview of the proposals, from a series of charts produced by the Kaiser Family Foundation this week. An interesting detail highlighted in another chart: 88% of voters – including 92% of Democrats and 85% of Republicans – want to give the government the power to negotiate prices with drug companies.
