Science Confirms: Watching Online Cat Videos Is Good for You

Looking at Grumpy Cat’s underbite and feline dwarfism just might just make you feel better about your bratty kid, your nagging spouse or your demanding boss. That’s right, according to a new study published in the journal Computers in Human Behavior, watching cat videos online reduces our negative feelings while raising our sense of well-being and boosting our energy levels.
Grumpy Cat, whose real pet name is Tardar Sauce, shares a manager with fellow YouTube stars Keyboard Cat and Nyan Cat. Last we checked, the famous feline had 7.7 million Likes on Facebook. In all, more than 2 million cat videos were posted on YouTube last year, gathering nearly 26 billion views. Cat videos had more views per video than any other category of YouTube content. That makes kittens more valuable eye candy than, say, Maxim’s Hot 100. (Taylor Swift topped the list this year, just in case you were wondering.)
Related: The Internet Power of Kim Kardashian’s Butt
For the new study, Jessica Gall Myrick, an assistant professor at the Indiana University Media School, surveyed nearly 7,000 Internet users about how watching cat videos affects their moods. She got a little help from Bloomington, Indiana resident Mike Bridavsky — the owner of Internet celebrity cat Lil Bub — who used social media to recruit participants for the survey.
The results should make you feel a bit less guilty about clicking through one cat video after another: “Even if they are watching cat videos on YouTube to procrastinate or while they should be working, the emotional pay-off may actually help people take on tough tasks afterward,” Myrick says.
Don’t think watching cat videos online is a pop culture phenomenon worthy of academic research? Myrick disagrees: “If we want to better understand the effects the Internet may have on us as individuals and on society, then researchers can’t ignore Internet cat videos anymore.”
Read the original paper on emotion regulation procrastination, and watching cat videos online here.
Chart of the Day: Boosting Corporate Tax Revenues
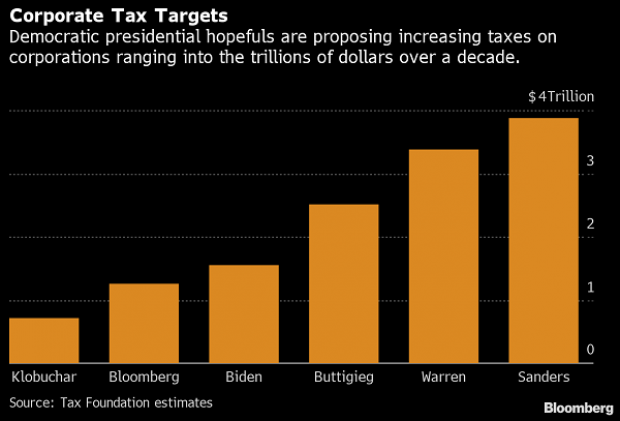
The leading candidates for the Democratic presidential nomination have all proposed increasing taxes on corporations, including raising income tax rates to levels ranging from 25% to 35%, up from the current 21% imposed by the Republican tax cuts in 2017. With Bernie Sanders leading the way at $3.9 trillion, here’s how much revenue the higher proposed corporate taxes, along with additional proposed surtaxes and reduced tax breaks, would generate over a decade, according to calculations by the right-leaning Tax Foundation, highlighted Wednesday by Bloomberg News.
Chart of the Day: Discretionary Spending Droops
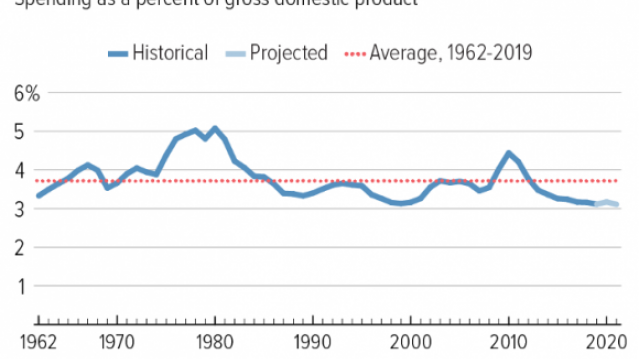
The federal government’s total non-defense discretionary spending – which covers everything from education and national parks to veterans’ medical care and low-income housing assistance – equals 3.2% of GDP in 2020, near historic lows going back to 1962, according to an analysis this week from the Center on Budget and Policy Priorities.
Chart of the Week: Trump Adds $4.7 Trillion in Debt
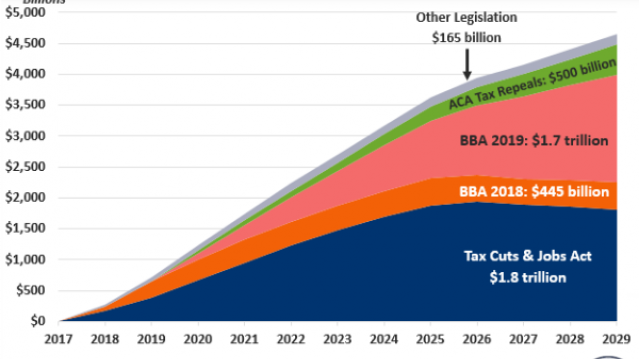
The Committee for a Responsible Federal Budget estimated this week that President Trump has now signed legislation that will add a total of $4.7 trillion to the national debt between 2017 and 2029. Tax cuts and spending increases account for similar portions of the projected increase, though if the individual tax cuts in the 2017 Republican overhaul are extended beyond their current expiration date at the end of 2025, they would add another $1 trillion in debt through 2029.
Chart of the Day: The Long Decline in Interest Rates

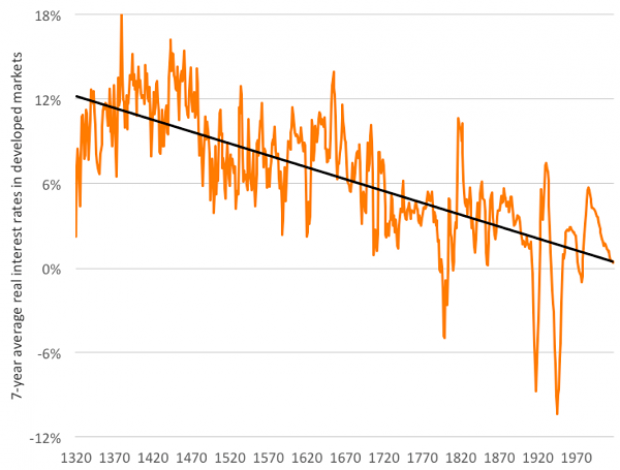
Are interest rates destined to move higher, increasing the cost of private and public debt? While many experts believe that higher rates are all but inevitable, historian Paul Schmelzing argues that today’s low-interest environment is consistent with a long-term trend stretching back 600 years.
The chart “shows a clear historical downtrend, with rates falling about 1% every 60 years to near zero today,” says Bloomberg’s Aaron Brown. “Rates do tend to revert to a mean, but that mean seems to be declining.”
Chart of the Day: Drug Price Plans Compared

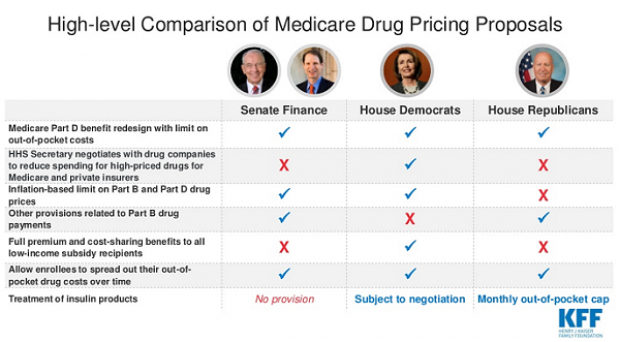
Lawmakers are considering three separate bills that are intended to reduce the cost of prescription drugs. Here’s an overview of the proposals, from a series of charts produced by the Kaiser Family Foundation this week. An interesting detail highlighted in another chart: 88% of voters – including 92% of Democrats and 85% of Republicans – want to give the government the power to negotiate prices with drug companies.

