Millions of Samsung Galaxy Phones May Be Vulnerable to Hackers

If you’re one of the millions of users of a Samsung Galaxy phone, you might be a potential target for a malicious hacker.
A report released today by NowSecure, a security firm located in Chicago, found that a glitch in Swift, the keyboard software used by default on all Samsung Galaxy devices could allow a remote attacker to compromise your phone.
This particular bug makes the phone vulnerable to what is known as a “man in the middle” attack. The Swift software consistently sends requests to a server, checking for updates. To someone with the right knowhow, though, it’s possible to impersonate Swift’s server and send through software that can be used to gain control of the device.
The main problem with this vulnerability is that there’s no real solution. The Swift keyboard is so integrated into Samsung’s software that it cannot be removed or disabled — even if it is switched out with a different keyboard app. Steering clear of unsecured Wi-Fi networks will make you less likely to be targeted, but it won’t render you invulnerable.
Related: 10 Biggest Tech Flops of the Century
Swift runs with elevated permissions, giving it pretty much free rein around the phone. This means that a hacker that worms his way into it can also access the Galaxy’s microphone and camera, track the user’s location or listen to their calls. They can even install apps.
NowSecure claims to have made Samsung and Google’s Android team aware of this vulnerability in late 2014, and Samsung reportedly has made a patch available to network providers. It’s not clear, though, whether providers have pushed out the patch to users yet. Many networks have a record of being notoriously slow to push through updates and security patches, and NowSecure’s tests found a number of Galaxy phones on different carriers were still vulnerable as of Tuesday.
If you’re of a more technical bent, you may be interested in seeing the details of NowSecure’s report on their blog. If you’re of a less technical bent, you might want to check with your carrier and try to avoid insecure Wi-Fi networks.
Two-Thirds of Parents Are Making This Big Financial Mistake
More than a third of Americans with young children don’t have any life insurance, and another third have policies with payouts of less than $100,000, according to a new analysis by Bankrate.com
The survey found that 42 percent of all Americans haven’t purchased life insurance, and about half of those with insurance have policies worth $100,000 or less, including 25 percent of those with a household income over $75,000.
Of course not everyone needs life insurance, but people who have family members depending on them financially should have a policy. The amount you need varies, depending on your future financial obligations, outstanding debts, and current assets.
Related: How to Calculate Your Life Insurance in 3 Easy Steps
Part of the reason for inadequate coverage could be that people underestimate the benefits they’re receiving from work (which don’t roll over from job to job), or they’re failing to update their policy after major life changes like the birth of a child or the purchase of a home.
Another factor: They’re misinformed about the price of life insurance. Eight in 10 consumers have incorrect ideas about the price of life insurance, with millennials overestimating the cost by 213 percent and Gen Xers overestimating it by 119 percent, according insurer trade organization LIMRA.
In addition to your age and health, the price of life insurance could be impacted by your credit history, driving record, and lifestyle.
The LIMRA study found that 30 percent of Americans think they need more life insurance, but more than half said it was unlikely that they’d purchase a policy in the next year.
The Rapidly Rising Death Toll of the Heroin Epidemic
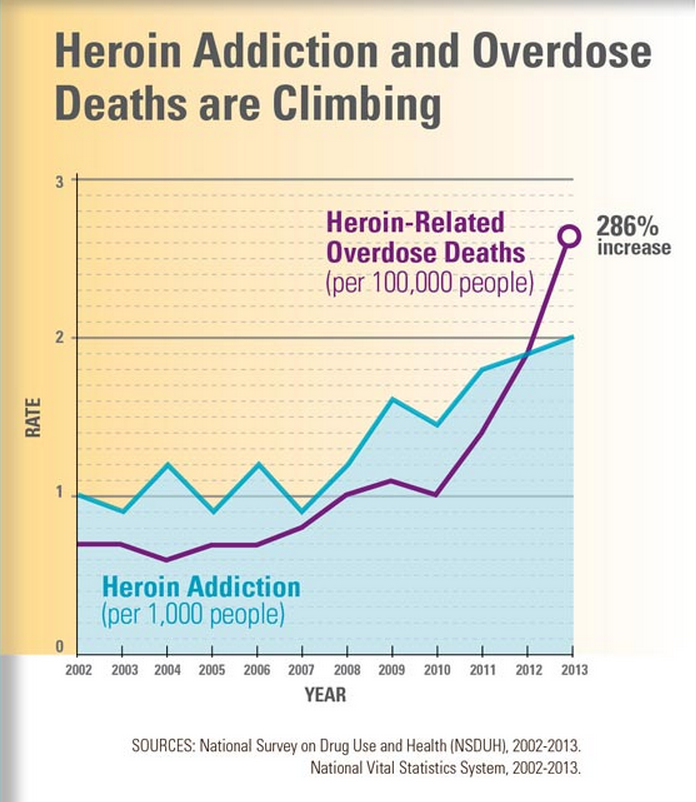
The death toll from the heroin epidemic has been climbing dramatically in recent years — and the annual rate of overdose deaths nearly doubled between 2011 and 2013, according to a new CDC study.
From 2002 through 2013, heroin use in the United States rose by 63 percent, and the rate of abuse or dependence climbed a staggering 90 percent. Deaths from heroin-related overdoses nearly quadrupled, with more than 8,200 people dying in 2013 alone.
The CDC report says that heroin use has increased across most demographic groups — men and women, most age groups, and across all income levels. Rates of heroin use are still highest among men, those ages 18 to 25, people with income less than $20,000 a year, people in urban areas, and those who do not have health insurance or are on Medicaid. But other groups are turning to the drug, too. “Some of the greatest increases occurred in demographic groups with historically low rates of heroin use: women, the privately insured and people with higher incomes,” the CDC says.
The heroin trend isn’t happening in isolation, the CDC study says. Almost all heroin users — 96 percent — also took at least one other drug, and 61 percent used at least three other drugs. Abuse or dependence on opioid painkillers is the strongest risk-factor for heroin use or addiction, the report says, with cocaine addiction also high on the list. People who are addicted to prescription opioid painkillers are 40 times more likely to use or be addicted to heroin, and 45 percent of people who used heroin were also addicted to painkillers.
Another key reason is that heroin is becoming cheaper and more widely available. According to the DEA, the increase in heroin seizures in the U.S. from 2010 and 2014 rose 81 percent, from 2,763 kilograms to 5,014 kilograms. More and more law enforcement agencies are identifying heroin as their primary drug threat, but the CDC report suggests that health care workers focus on reducing the abuse of painkillers by improving prescribing practices.
The study also recommends that states increase access to “medication-assisted treatment” programs that use methadone, buprenorphine and naltrexone along with behavioral counseling. And it says the rapid rise in heroin-related deaths highlights an “urgent need” to broaden access to naloxone, a drug that can reverse the effects of heroin and opioid overdose.
Here’s Why Economists Are Worried About A New Housing Bubble

After posting their 39th consecutive month of year-over-year price gains, home prices in 33 states and the District of Columbia are at or within 10 percent of record highs, according to a report issued today by CoreLogic.
Home prices increased 6.3 percent year-over-year in May, and 1.7 percent month-over-month. Relatively low mortgage rates have helped fuel the price gains. In cities like San Francisco, where there is limited supply and high demand, prices are growing at a double-digit clip.
Prices are so high in certain areas that some economists are starting to worry about localized bubbles. The number of homes on the market is increasing slightly. Total housing inventory at the end of may reached 2.29 million houses, 1.8 percent more than this time last year, according to the National Association of Realtors. That’s a 5.1-month supply, giving sellers a slight edge in today’s market. (A six-month supply is considered a healthy market.)
Related: Get ready for Another Real Estate Bubble
South Carolina saw the biggest price gains, with homes showing annual appreciation of 10.3 percent. Other states showing big gains were Colorado (9.8 percent) and Washington (8.8 percent), CoreLogic reports.
High prices have also spurred builders to start constructing new single-family homes, sales of which increased 23 percent year-over-year in May.
While most states have seen price gains, five states (Massachusetts, Connecticut, Maryland, Mississippi, and Louisiana) saw local home prices fall in May.
CoreLogic economists expect prices to increase 5.1 percent year-over-year in June and 0.8 percent month to month.
Looking for Likes? When to Post on Facebook for Maximum Attention

Trying to decide when to post photo updates to your “Summer 2015” album so the maximum number of people click through, comment on, and like your filtered selfies? Look no further. A new study conducted by the social media analytics firm Klout can tell you the best time and day of the week to post on Facebook and Twitter, depending where you are in the world.
The study found that posting in the late morning and early afternoons on Tuesdays and Wednesdays tends to generate the most engagement. Thursdays tend to be quiet, Fridays are quieter still, and the weekends are the quietest. On Mondays, the activity level begins to ramp up again as the work week begins and bored office workers take social media breaks.
Optimal times also depend on location. Tokyo peaks at the earliest time among cities studied, between 7 a.m. and 9 a.m. Paris has a high level of engagement once in the morning and once in the afternoon. In San Francisco, between 9 a.m. and 10 a.m. is ideal for posting. The most favorable time in New York is just before noon. London peaks the latest, with users becoming fully engaged on Twitter and Facebook only in the early afternoon.
Thinking about posting a picture of your cute new nephew at night? Don’t even bother if you want maximum engagement from your followers and friends. While one explanation is that fewer people are online at night, another is that most likes, shares, and comments occur within a short window of time after someone posts something. Researchers of the study found the majority of reactions were within the first two hours of posting time.
Using a sample set of half a million active users and more than 25 million messages over 56 days, the report boasts a reaction gain of up to 4 percent on Twitter and 17 percent on Facebook when the recommended posting times are used.
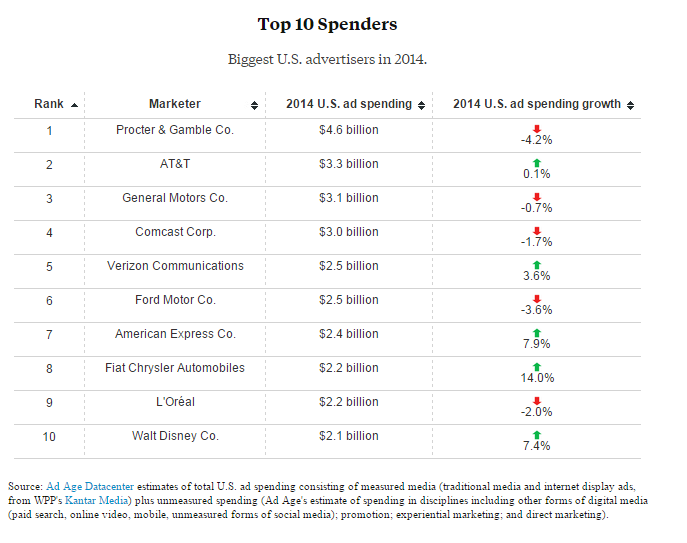
Why We All Buy Tide: The 10 Biggest Advertisers in the U.S.
The 200 top national advertisers spent a record $137.8 billion last year trying to get you to buy more of their goods and services, an increase of 2 percent over 2013, according to Ad Age’s latest annual spending review.
That total was slightly more than the GDP of Hungary last year, but the growth rate was the lowest since 2009, as advertisers looked to get the most for their money. Internet display advertising among those 200 marketing Goliaths dropped by 13.3 percent.
Overall, 38 marketers spent more than $1 billion on advertising last year. Procter & Gamble remains the country’s (and the world’s) largest advertiser. It shelled out $4.6 billion in the U.S. alone to promote brands such as Crest, Duracell, Pampers and Tide — or well over $1 billion more than the next biggest spender. P&G’s CFO recently revealed plans to cut ad spending by as much as $500 million, though.
Here’s Ad Age’s list of the 10 biggest advertisers in the U.S. last year: