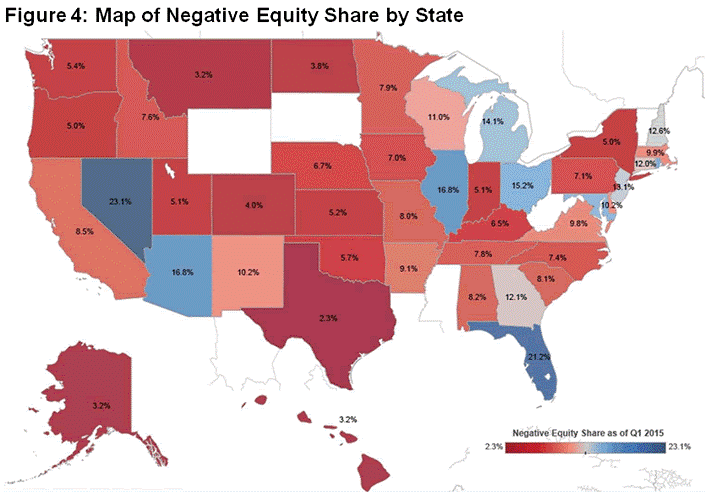
Five States Account for 31% of Underwater Mortgages
Here’s another sign that the housing market keeps getting healthier: More than 250,000 formerly underwater homes regained equity in the first quarter of 2015, according to CoreLogic, meaning that the value of the homes rose above the value of the mortgages on them.
Borrower equity grew more by $694 billion in the quarter, and more than 90 percent of mortgaged American homes now have equity. Such a surge in homeowner wealth has historically led to increased consumer spending and investment.
“Many homeowners are emerging from the negative equity trap, which bodes well for a continued recovery in the housing market,” Anand Nallathambi, president and CEO of CoreLogic said in a statement. “With the economy improving and homeowners building equity, albeit slowly, the potential exists for an increase in housing stock available for sale, which would ease the current imbalance in supply and demand.”
Related: 9 Real Estate Trends to Watch in 2015
Still, 5.1 million mortgaged homes remain underwater, representing 10.2 percent of all mortgaged properties. Five states — Nevada, Florida, Illinois, Arizona and Rhode Island — account for nearly a third of all properties with negative equity. As of the end of the fourth quarter, 10.8 percent of homes — or about 5.4 million properties — were underwater.
The number of underwater homes has decreased year-over-year by 1.2 million and the aggregate value of negative equity has fallen 13 percent to $337.4 billion.
Texas was the state with the fewest underwater properties; 98 percent of homeowners there with a mortgage have equity in their homes.
Just under 20 percent of homes with a mortgage are considered “under-equitied,” meaning that they have less than 20 percent equity and would likely have trouble refinancing their property or obtaining new financing to sell their home and buy another.
A 5 percent increase in home values nationwide would bring another million homeowners into positive equity territory, CoreLogic economists predict.
Tax Refunds Rebound

Smaller refunds in the first few weeks of the current tax season were shaping up to be a political problem for Republicans, but new data from the IRS shows that the value of refund checks has snapped back and is now running 1.3 percent higher than last year. The average refund through February 23 last year was $3,103, while the average refund through February 22 of 2019 was $3,143 – a difference of $40. The chart below from J.P. Morgan shows how refunds performed over the last 3 years.

Number of the Day: $22 Trillion

The total national debt surpassed $22 trillion on Monday. Total public debt outstanding reached $22,012,840,891,685.32, to be exact. That figure is up by more than $1.3 trillion over the past 12 months and by more than $2 trillion since President Trump took office.
Chart of the Week: The Soaring Cost of Insulin

The cost of insulin used to treat Type 1 diabetes nearly doubled between 2012 and 2016, according to an analysis released this week by the Health Care Cost Institute. Researchers found that the average point-of-sale price increased “from $7.80 a day in 2012 to $15 a day in 2016 for someone using an average amount of insulin (60 units per day).” Annual spending per person on insulin rose from $2,864 to $5,705 over the five-year period. And by 2016, insulin costs accounted for nearly a third of all heath care spending for those with Type 1 diabetes (see the chart below), which rose from $12,467 in 2012 to $18,494.

Chart of the Day: Shutdown Hits Like a Hurricane

The partial government shutdown has hit the economy like a hurricane – and not just metaphorically. Analysts at the Committee for a Responsible Federal Budget said Tuesday that the shutdown has now cost the economy about $26 billion, close to the average cost of $27 billion per hurricane calculated by the Congressional Budget Office for storms striking the U.S. between 2000 and 2015. From an economic point of view, it’s basically “a self-imposed natural disaster,” CRFB said.

Chart of the Week: Lowering Medicare Drug Prices

The U.S. could save billions of dollars a year if Medicare were empowered to negotiate drug prices directly with pharmaceutical companies, according to a paper published by JAMA Internal Medicine earlier this week. Researchers compared the prices of the top 50 oral drugs in Medicare Part D to the prices for the same drugs at the Department of Veterans Affairs, which negotiates its own prices and uses a national formulary. They found that Medicare’s total spending was much higher than it would have been with VA pricing.
In 2016, for example, Medicare Part D spent $32.5 billion on the top 50 drugs but would have spent $18 billion if VA prices were in effect – or roughly 45 percent less. And the savings would likely be larger still, Axios’s Bob Herman said, since the study did not consider high-cost injectable drugs such as insulin.
