6.6M Homes at Risk of Hurricane Damage This Year. Here’s Which States They’re In
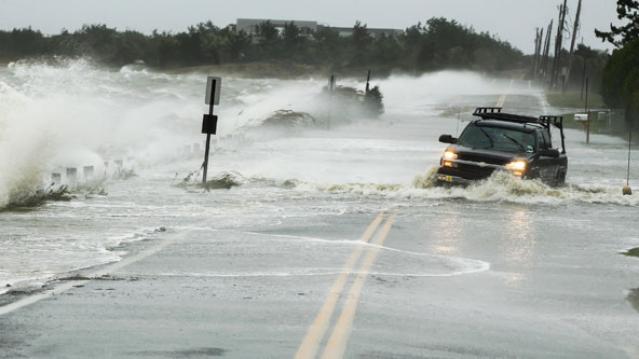
As hurricane season gets underway, real estate analytics firm CoreLogic is warning that there are more than 6.6 million U.S. homes at risk of being hit by a storm surge. That could lead to as much at $1.5 trillion in damage.
The homes are in 19 states and the District of Columbia along the Atlantic and Gulf Coasts. Six states account for more than three-quarters of all at-risk homes, with Florida having the most (2.5 million), followed by Louisiana (760,000), New York (465,000), New Jersey (446,148), Texas (441,304) and Virginia (420,052).
Related: How Climate Change Costs Could Soar to the Billions
“The number of hurricanes each year is less important than the location of where the next hurricane will come ashore,” CoreLogic’s senior hazard risk analyst said in a statement. “It only takes one hurricane that pushes storm surge into a major metropolitan area for the damage to tally in the billions of dollars. With new home construction, and any amount of sea-level rise, the number of homes at risk of storm surge damage will continue to increase.”
The District of Columbia has the lowest number of properties at risk (3,700), followed by New Hampshire (12,400) and Maine (22,500
State Table (Ranked by Number of Homes at Risk)
|
Rank |
State |
Extreme |
Very High |
High |
Moderate |
Low* |
Total |
|
1 |
Florida |
793,204 |
461,632 |
524,923 |
352,102 |
377,951 |
2,509,812 |
|
2 |
Louisiana |
97,760 |
104,059 |
337,495 |
138,762 |
82,196 |
760,272 |
|
3 |
New York |
127,325 |
114,876 |
131,039 |
91,294 |
N/A |
464,534 |
|
4 |
New Jersey |
116,581 |
178,668 |
73,303 |
77,596 |
N/A |
446,148 |
|
5 |
Texas |
45,800 |
70,894 |
112,189 |
116,168 |
96,253 |
441,304 |
|
6 |
Virginia |
94,260 |
115,770 |
98,463 |
84,015 |
27,544 |
420,052 |
|
7 |
South Carolina |
107,443 |
57,327 |
65,885 |
46,799 |
30,961 |
308,415 |
|
8 |
North Carolina |
73,463 |
51,927 |
48,595 |
40,155 |
37,347 |
251,487 |
|
9 |
Massachusetts |
31,420 |
65,279 |
74,413 |
49,325 |
N/A |
220,437 |
|
10 |
Maryland |
47,990 |
39,966 |
27,591 |
28,975 |
N/A |
144,522 |
|
11 |
Georgia |
41,970 |
52,281 |
28,852 |
19,190 |
8,465 |
150,758 |
|
12 |
Pennsylvania |
1,467 |
45,776 |
37,983 |
32,426 |
N/A |
117,652 |
|
13 |
Mississippi |
14,809 |
20,643 |
29,387 |
27,507 |
10,588 |
102,934 |
|
14 |
Connecticut |
25,292 |
23,656 |
22,230 |
26,529 |
N/A |
97,707 |
|
15 |
Alabama |
7,403 |
12,707 |
10,182 |
13,749 |
14,086 |
58,127 |
|
16 |
Delaware |
11,523 |
10,854 |
13,528 |
13,811 |
N/A |
49,716 |
|
17 |
Rhode Island |
6,595 |
5,988 |
6,720 |
7,187 |
N/A |
26,490 |
|
18 |
Maine |
5,159 |
2,753 |
7,368 |
7,211 |
N/A |
22,491 |
|
19 |
New Hampshire |
2,514 |
3,470 |
4,234 |
2,272 |
N/A |
12,490 |
|
20 |
District of Columbia |
N/A** |
N/A** |
545 |
3,123 |
N/A |
3,668 |
|
Total |
1,651,978 |
1,438,526 |
1,654,925 |
1,178,196 |
685,391 |
6,609,016 |
* The "Low" risk category is based on Category 5 hurricanes, which are not likely along the northeastern Atlantic coast. States in that area have N/A designated for the Low category due to the extremely low probability of a Category 5 storm affecting that area.
** Washington, D.C. has no Atlantic coastal properties, but can be affected by larger hurricanes that push storm surge into the Potomac River. Category 1 and 2 storms will likely not generate sufficient storm surge to affect properties in Washington, D.C.
Tax Refunds Rebound

Smaller refunds in the first few weeks of the current tax season were shaping up to be a political problem for Republicans, but new data from the IRS shows that the value of refund checks has snapped back and is now running 1.3 percent higher than last year. The average refund through February 23 last year was $3,103, while the average refund through February 22 of 2019 was $3,143 – a difference of $40. The chart below from J.P. Morgan shows how refunds performed over the last 3 years.

Number of the Day: $22 Trillion

The total national debt surpassed $22 trillion on Monday. Total public debt outstanding reached $22,012,840,891,685.32, to be exact. That figure is up by more than $1.3 trillion over the past 12 months and by more than $2 trillion since President Trump took office.
Chart of the Week: The Soaring Cost of Insulin

The cost of insulin used to treat Type 1 diabetes nearly doubled between 2012 and 2016, according to an analysis released this week by the Health Care Cost Institute. Researchers found that the average point-of-sale price increased “from $7.80 a day in 2012 to $15 a day in 2016 for someone using an average amount of insulin (60 units per day).” Annual spending per person on insulin rose from $2,864 to $5,705 over the five-year period. And by 2016, insulin costs accounted for nearly a third of all heath care spending for those with Type 1 diabetes (see the chart below), which rose from $12,467 in 2012 to $18,494.

Chart of the Day: Shutdown Hits Like a Hurricane

The partial government shutdown has hit the economy like a hurricane – and not just metaphorically. Analysts at the Committee for a Responsible Federal Budget said Tuesday that the shutdown has now cost the economy about $26 billion, close to the average cost of $27 billion per hurricane calculated by the Congressional Budget Office for storms striking the U.S. between 2000 and 2015. From an economic point of view, it’s basically “a self-imposed natural disaster,” CRFB said.

Chart of the Week: Lowering Medicare Drug Prices

The U.S. could save billions of dollars a year if Medicare were empowered to negotiate drug prices directly with pharmaceutical companies, according to a paper published by JAMA Internal Medicine earlier this week. Researchers compared the prices of the top 50 oral drugs in Medicare Part D to the prices for the same drugs at the Department of Veterans Affairs, which negotiates its own prices and uses a national formulary. They found that Medicare’s total spending was much higher than it would have been with VA pricing.
In 2016, for example, Medicare Part D spent $32.5 billion on the top 50 drugs but would have spent $18 billion if VA prices were in effect – or roughly 45 percent less. And the savings would likely be larger still, Axios’s Bob Herman said, since the study did not consider high-cost injectable drugs such as insulin.
