The Woefully Distorted Federal Policies on Child Abuse
Here’s something just in from the world of grossly distorted government policy:
Every year, roughly 680,000 children are reported victims of neglect or abuse by their parents in this country – a tragic statistic reflective of troubling societal, psychological and economic problems. Even worse, 1,520 children died from maltreatment in 2013, nearly 80 percent of them at the hands of their own parents.
Related: Feds Blow $100 Billion Annually on Incorrect Payments
Federal and state authorities over the years have developed a large and costly system for reporting and investigating maltreatment, removing endangered children from their homes, and preventing and treating problems of parents and children.
But as a new study touted on Wednesday by the Brookings Institution concludes, the federal government provides states with far more money to support kids once they have been removed from their homes and placed in foster care than it provides for prevention and treatment programs to keep the kids out of foster homes in the first place.
And the disparity is startling.
Two of the largest grant programs in Title IV-B of the Social Security Act provide states with funding totaling around $650 million annually for “front end” services designed to prevent or treat parent and child problems that contribute to abuse and neglect. They address problems such as substance abuse, family violence and mental health issues.
Related: Time to Stop Social Safety Net Child Abuse
Yet another series of programs in Title IV-E of the Social Security law provides states with open-ended funding that totaled about $6.9 billion in 2014. Those funds pay almost exclusively for out-of-home care for children from poor families, along with the administrative and training expenses associated with foster care, adoption, and guardianship.
That’s a 10 to 1 disparity in funding for the two efforts – one to try to hold families together and the other to move children out of their homes and into foster care.
“Congress has the opportunity to change the funding formula under Title IV of the Social Security Act so that states have the flexibility to put money where it will be most effective at keeping at-risk children safe, ensuring that they have a permanent home, and promoting their well-being,” wrote Ron Haskins, Lawrence M. Berger and Janet Currie, the authors of the study.
In their policy brief, “Can States Improve Children’s Health by Preventing Abuse and Neglect,” Haskins, a Senior Fellow in Economic Studies at Brookings, Currie of Princeton University and Berger of the University of Wisconsin-Madison, write that revising the grant programs could improve the welfare of children who are at risk of abuse or neglect.
This is something else that lawmakers might consider later this year when they begin to focus on disability insurance and other programs within the Social Security law.
Tax Refunds Rebound
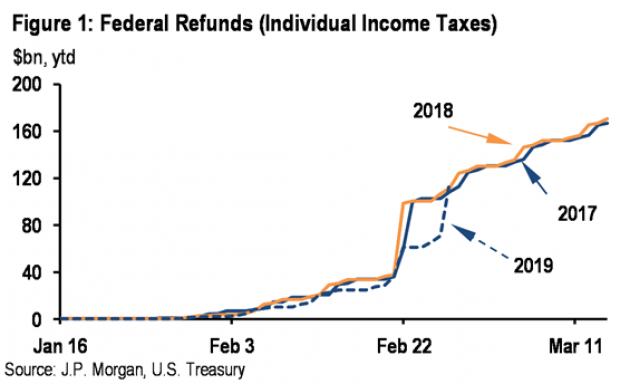
Smaller refunds in the first few weeks of the current tax season were shaping up to be a political problem for Republicans, but new data from the IRS shows that the value of refund checks has snapped back and is now running 1.3 percent higher than last year. The average refund through February 23 last year was $3,103, while the average refund through February 22 of 2019 was $3,143 – a difference of $40. The chart below from J.P. Morgan shows how refunds performed over the last 3 years.
Number of the Day: $22 Trillion
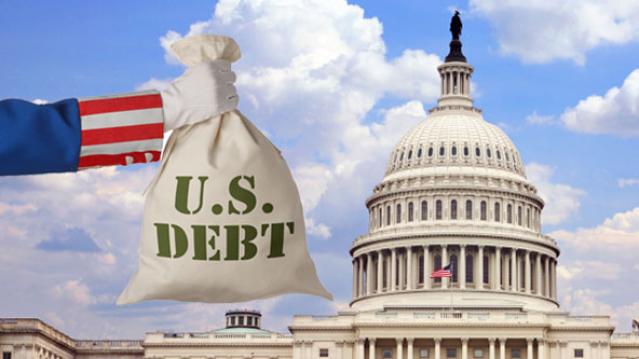
The total national debt surpassed $22 trillion on Monday. Total public debt outstanding reached $22,012,840,891,685.32, to be exact. That figure is up by more than $1.3 trillion over the past 12 months and by more than $2 trillion since President Trump took office.
Chart of the Week: The Soaring Cost of Insulin
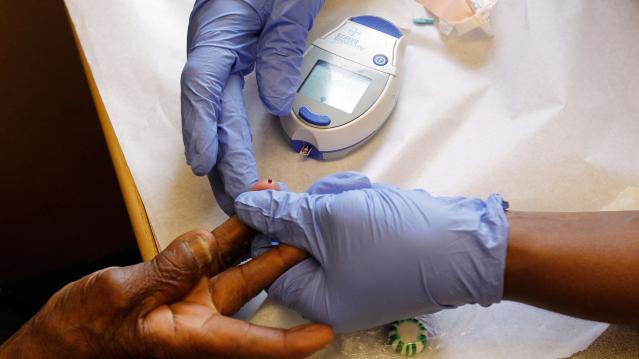
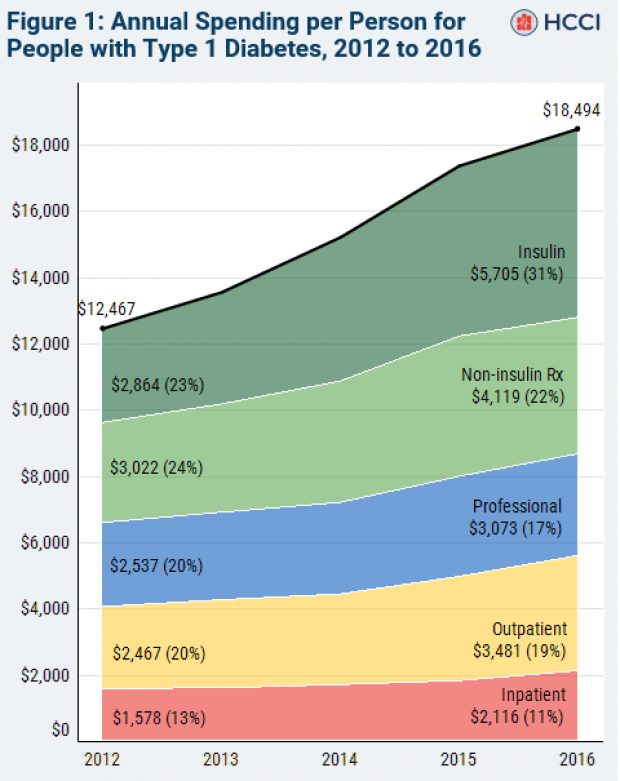
The cost of insulin used to treat Type 1 diabetes nearly doubled between 2012 and 2016, according to an analysis released this week by the Health Care Cost Institute. Researchers found that the average point-of-sale price increased “from $7.80 a day in 2012 to $15 a day in 2016 for someone using an average amount of insulin (60 units per day).” Annual spending per person on insulin rose from $2,864 to $5,705 over the five-year period. And by 2016, insulin costs accounted for nearly a third of all heath care spending for those with Type 1 diabetes (see the chart below), which rose from $12,467 in 2012 to $18,494.
Chart of the Day: Shutdown Hits Like a Hurricane

The partial government shutdown has hit the economy like a hurricane – and not just metaphorically. Analysts at the Committee for a Responsible Federal Budget said Tuesday that the shutdown has now cost the economy about $26 billion, close to the average cost of $27 billion per hurricane calculated by the Congressional Budget Office for storms striking the U.S. between 2000 and 2015. From an economic point of view, it’s basically “a self-imposed natural disaster,” CRFB said.
Chart of the Week: Lowering Medicare Drug Prices

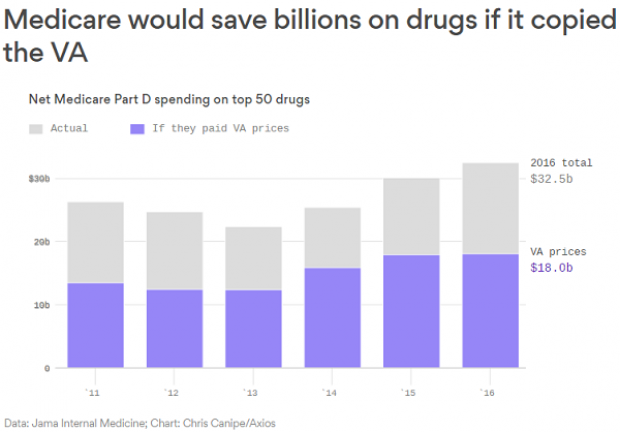
The U.S. could save billions of dollars a year if Medicare were empowered to negotiate drug prices directly with pharmaceutical companies, according to a paper published by JAMA Internal Medicine earlier this week. Researchers compared the prices of the top 50 oral drugs in Medicare Part D to the prices for the same drugs at the Department of Veterans Affairs, which negotiates its own prices and uses a national formulary. They found that Medicare’s total spending was much higher than it would have been with VA pricing.
In 2016, for example, Medicare Part D spent $32.5 billion on the top 50 drugs but would have spent $18 billion if VA prices were in effect – or roughly 45 percent less. And the savings would likely be larger still, Axios’s Bob Herman said, since the study did not consider high-cost injectable drugs such as insulin.

