After three years of cautious spending and paying down debt, American households are in far better financial shape and spending is once more on the rise. This year’s holiday shopping season has been the best for merchants since 2006, probably strong enough to push economic growth to a healthy 4 percent annual rate in the final three months of the year.
After the bursting of the housing and financial bubbles left them with the highest debt burdens in modern history, consumers haven’t had to take on new debt to finance their current spending. Incomes have been going up fast enough that the personal savings rate, which fell close to zero at times during the boom, has stayed well above 5 percent in recent months. Over the 12 months ended in November, both personal consumption spending and personal incomes were up 3.8 percent, the Commerce Department reported last week.
It's not just households that have benefited. As debt burdens have eased, borrowers are keeping more current in their payments, helping financial institutions recover from the downturn. "Delinquency and charge off rates have been more encouraging, with rates falling for measures of credit card and real estate debt," said Young Kim, an analyst at Stone & McCarthy Research Associates. "The implications are good news for the economy."
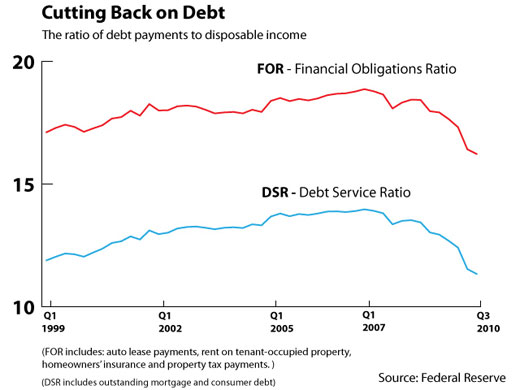
The improvement in household balance sheets is apparent in new quarterly data from the Federal Reserve: The household debt-service ratio, which tracks the cost of required payments on outstanding mortgage and consumer debt as a share of disposable personal income--which essentially is after-tax income, and the financial obligations ratio, or FOR, which adds auto lease payments, rents, homeowners' insurance and property tax payments.

The debt-service ratio peaked just shy of 14 percent in the fall of 2007. That is, 14 percent of after-tax incomes were going to pay mortgages, credit cards and other consumer loans. Similarly, nearly 19 percent was going to meet those plus the other financial obligations.
Over the past three years, both ratios have plunged faster than any other time in the last three decades. In this year’s third quarter, the ratios were down to just under 12 percent and 17 percent, respectively. That 2 percentage point drop meant that households' required debt payments had declined by $228 billion annually and they clearly are still headed down--leaving more money to save or spend for other things.
Of course, some of the lower debt burden might be the result of the way lenders clamped down on borrowing once the crisis was underway. Home equity lines of credit were reduced and standards for new loans of all types became much more stringent than they had been. Millions of families unable to keep up their mortgage payments lost their homes to bank foreclosures and millions more still face that threat. Tighter lending standards prevented some would-be home buyers from getting mortgages at all and high unemployment has kept consumption lower than it otherwise would have been.
But there are other signs that things are turning around. Goldman Sachs economists, for example, measure the gap between total income and total spending of U.S. households and businesses -- called the private-sector financial balance. Before the financial crisis hit, that balance was negative--that is, households and businesses together were spending more than they were taking in--to the tune of about 4 percent of Gross Domestic Product. Then, between mid-2006 and mid-2009, the balance swung sharply positive as households spent less and saved more, and businesses cut spending for new plants and equipment and began to pile up cash.
The swing, equal to 12.5 percent of GDP was "the largest in at least 60 years" and triggered the deep recession, the Goldman economists told clients in a memo earlier this month. Now, "the pace of private-sector deleveraging is slowing in an environment of somewhat lower debt/income ratios, improving credit quality and moderating lending standards," the economists said. The result, they predicted, will be stronger growth in 2011.
Mickey Levy, chief economist at Bank of America, and his colleague Peter Kretzmer recently compared consumer behavior since the recent crisis began to behavior during and after six prior recessions. The results underscored just how much more consumers cut back this time around. During this recession, consumption declined at a 1.7 percent annual rate, and in the first year of the recovery that began in mid-2009, it increased only 2 percent. That was much weaker than in the earlier recessions, in which spending only slowed down to a 0.7 percent rate instead of falling. And then in the first year of recovery, consumption rose 4.4 percent. That suggests room for growth next year.
Interestingly, renters as a group have a much higher financial obligations ratio than homeowners, even though they have no mortgage. In the third quarter, the FOR of homeowners was 15.3 percent-- about one-third due to consumer debt and two-thirds to mortgages. In contrast, renters’ FOR was just under 24 percent, with the figure down only about a single percentage point since its pre-crisis peak.
During the housing boom, when the focus was on buying rather than renting, rents stagnated and the financial obligations of renters fell quite sharply, after peaking at 31 percent during the brief 2001 recession. Currently, the ratio is nearly as low as it has been since 1994.
"Renters tend to be younger and generally earn less than homeowners," said Stone & McCarthy's Kim. "The fact that renter payments are a larger share of their income should be little surprise."
The story told by changes in all these debt payment ratios is the same. The burdens are less onerous relative to disposable income than they were and therefore less of a drag on economic growth next year. Unless something new goes awry, more consumer spending--in the context of a moderately strong savings rate--should lead to more hiring and more investment by businesses and a further drop in debt service burdens.


