Why You Might Want to Cancel That Restaurant Reservation
The cost of dining out rose 3 percent in May year-over-year, while the amount paid to eat at home inched up just 0.6 percent. The growing disparity in prices could prompt consumers to abandon restaurants for home-cooked meals, according to a report today by Bloomberg.
“Eating in hasn’t been this attractive compared to dining out since 2010,” Bloomberg reports. That’s good news for consumers worried about their budgets, but could be a problem for restaurants’ bottom lines.
So far, consumers aren’t making the shift. This spring, spending at restaurants and bars totaled more than sales at grocery stores for the first time.
Related: The 11 Worst Fast Food Restaurants in America
Part of the reason consumers are sticking with restaurants could be that wages are starting to slowly increase, so consumers have a little more money to spend on meals.
They may also be dining out because it’s often an easier option. Shopping and preparing meals takes time – time that people simply don’t have these days. A quarter of employees say that they are working after the standard work day has ended, and about 40 percent work at least one weekend a month, according to Staples Advantage. That leaves little time for food prep.
Supermarkets have responded to the time-pressed consumer by increasingly offering prepared meals that require little more than reheating at home. The prices for such meals tend to be higher than the cost of their ingredients but less than the price of eating out or ordering in.
Here’s a Good Sign for the Economy: Americans Are Hitting the Road
Driving is as American as apple pie, but the Great Recession took a big bite out of the nation’s driving habits. Total miles driven in the U.S. hit a peak in the fall of 2007 just before the recession hit and fell for several years after. Total miles driven bottomed out in 2011, moving slowly higher since then.
The Department of Transportation reported this week that total miles driven has hit a new, all-time high. Vehicles drove 7.3 billion miles in May, up 2.7 percent from May, 2014. The annual number is even more impressive: Using a moving 12-month figure, total miles traveled in the past year registers at 3.08 trillion miles. This graph from Calculated Risk paints the picture:
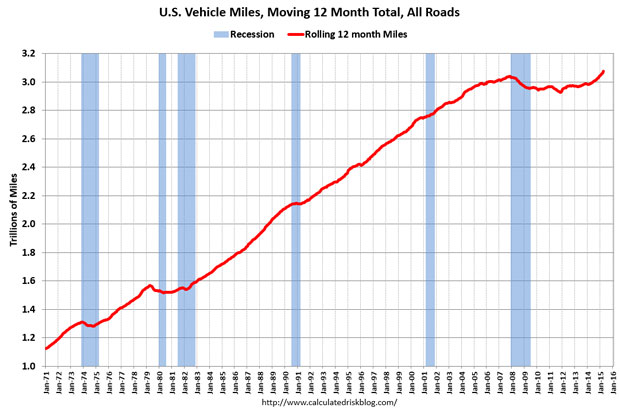
This sure seems like good news for the U.S. economy. The data for miles driven reflects booms and busts in the economy, and seeing the numbers climb suggests the economy is still gaining strength.
However, the raw numbers may not be quite as good as they first appear. Even though miles driven are up, so is the U.S. population. Once the data is adjusted for population growth, a less robust picture emerges. Doug Short at Advisor Perspectives ran the numbers, concluding that on a per capita basis, miles driven is still well below its pre-recession peak. Here’s his chart:
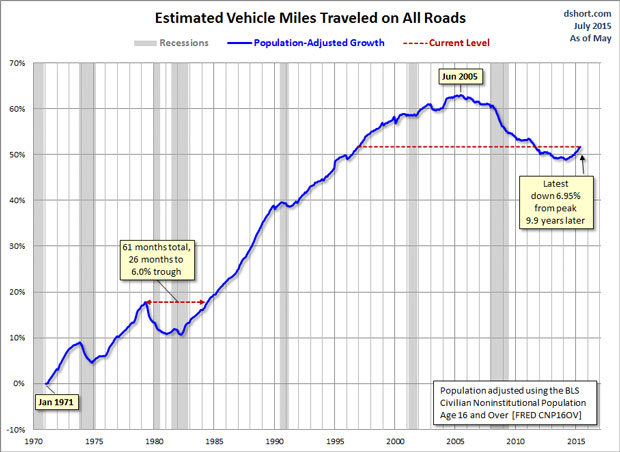
It looks like the U.S. economy still has a long way to go to get back to its pre-recession strength, at least as measured by by the rough proxy of total miles driven.
Why Investors Prefer Real Estate to Stocks, Bond and Gold

Americans still feel skittish about the stock market. When it comes to long-term investments, real estate is still preferred over cash or the stock market, Bankrate.com reports in a new study. For long term investments over 10 years or more, 27 percent chose real estate, 23 percent preferred cash investments, and 17 percent opted for the stock market. Gold and precious metals came in fourth at 14 percent, and bonds debuted at 5 percent.
Related: Clinton’s Capital Gains Tax Plan Aims at Long-Term Investment
Although the S&P 500 has risen 27 percent over the past two years, Americans were only slightly more inclined to favor stocks in 2015 than they were in 2013.
The only exception to the brick and mortar policy? Households headed by college graduates were the most likely to prefer stocks. In the western U.S., real estate was preferred nearly two to one over any other investment choice.
The survey of 1,000 adults living in the continental U.S. yielded some surprises across gender, age, income, location, and political party. Men were more likely to favor real estate, while women were more likely to favor cash investments.
At 32 percent, the majority of millennials--those between 18 and 29 years old--favored cold, hard cash, while 32 percent of participants between the ages of 30 and 40 stuck with real estate.
Related: U.S. Real Estate ETF Rally Faces Test With Rate Rise
Lower-income workers with salaries of less than $50,000 felt “more secure” than their higher earning counterparts, who were making $50,000 to $74,900. And Republicans were three times more likely to say they felt “less secure” about their jobs as Democrats.
Bankrate’s Financial Security Index for July remained positive for the 14th consecutive month. However the July reading was the second lowest in 2015, due in part to a decline in job security with 22 percent feeling “more secure” about their jobs than 12 months ago and 14 percent feeling “less secure.” Sixty-two percent felt “about the same.”
Thync Before You Act – A New Wearable Device Made for 'The Donald'

If you thought people looked foolish wearing Google Glass, wait until you see one of your coworkers sticking a white piece of plastic on her forehead, hooked around her ear. I learned about Thync, a $300 electric gizmo, reading Geoffrey Fowler’s Wall Street Journal column Tuesday.
Fowler tested it, so I don’t have to, but I just know I’ll be seeing this piece of wearable tech around town among the gadgerati I sometimes hang out with. Thync’s unique selling proposition is vibes, uncommonly known as transdermal electrical neuromodulation. Translation—it’s a low-grade form of shock therapy. The company says they’ve tested the device over years of research with their neuroscientists and engineers to give us Calm vibes or Energy vibes.

You’ll have to go to Fowler’s story to view a graphic of how this dildo for the brain actually functions, but Folwer describes the Energy vibe this way: “The sensation is like drinking an espresso, accompanied by a tingle of prickly heat behind the ear.” He compares the hour-long Calm vibe to having a glass of wine.
Like everything else related to wearable tech and the Internet of Things, the company is well funded by Silicon Valley venture capital firms, which are apparently looking for the next Fitbit. And why not? Brain fitness. I know a few people who could benefit from Thync if it works as promised.
Let’s start by getting the company to give one to Donald Trump, set it permanently on the Calm setting, and turn up the juice.
Top Reads from The Fiscal Times:
- Six Amazing Features Hidden in Your Smartphone
- Facebook Must Hand Over NY Users' Info to Prosecutors
- The Incredible Disappearing American-Made Car
Why You Should Shop Around for Car Insurance Right Now
If you haven’t shopped for auto insurance recently, you might want to spend an hour or so checking out other deals. It pays to review your policy and check what’s out there.
A new survey from insuranceQuotes.com shows that 66 percent of policyholders never or only rarely check to see if they could get the same or better coverage at a better price. The average American driver has been with the same auto insurance company for 12 years, and some have stayed with the same insurer for two to three decades, or longer.
Related: 5 Ways to Lower Your Car Insurance—Right Now
Millennials age 18 to 29 and senior citizens number among those least likely to shop around for auto insurance. At least six in 10 millennials with auto insurance assume you have to wait until your renewal date to switch insurance companies. And they’re not alone: 46 percent of Americans do not know that you can switch your auto insurance company at any time.
One of the reasons auto insurance may not be a priority for consumers? Auto pay options, while convenient, could be keeping car insurance payments and rates out of sight—and out of mind. Human nature and procrastination is another. “People think that it’s a task that might be difficult and time-consuming,” says senior analyst Laura Adams, “but it could be as simple as going to a website like insurancequotes.com, putting your information in for a free quote, and getting multiple quotes back. There’s no financial risk in looking for a new rate.”
Just spending an hour once a year to compare quotes from three different companies could potentially save you hundreds or thousands of dollars.
Related: A Quick Way to Save Big on Your Insurance
Experts suggest checking your car insurance rates the same way you would remember to change the oil in your car or swap the air filters in your home. Here are some tips to get started:
- Ask your current insurer if there are any company discounts you might be eligible for but don’t know about, such as the good-student discount. For college and grad students who have a B-average or better (or their parents) that could result in a significant discount.
- If you find a better deal, tell your current insurance company that you’re thinking of switching unless they can match the new offer or exceed it.
- If your current insurer refuses to negotiate, sign up for the new policy first—and then cancel the old one. “You always want to make sure you’re covered,” says Evans. “Insurance companies do not like to see a gap in coverage, and your rates could rise.”
- To get a wider variety of quotes, get online quotes from insurance company websites, consult with an independent agent, and look into companies that don’t use independent agents as well.
“Being married can cause your rate to decrease,” says Evan. “Marriage, getting good grades--these are all things that you have to self-report, which is why I recommend revisiting auto insurance at least once a year, as your life situation could change.”
Feeling Flush, More Parents Open Their Wallets for College Spending

As lingering financial fears from the recession fade, more parents are willing and able to open their wallets to pay for their children’s educations.
Parents have become the top source of college funding for the first time since 2010. According to a new report from private student loan lender Sallie Mae’s, parental income and savings covered 32 percent of college costs in the academic year 2014-15, while scholarships and grants covered 30 percent.
Families spent an average of $24,164 on college this year, a 16 percent rise in spending from the previous year and the largest increase since 2009-10. The money spent covers costs of tuition, books, and living expenses.
Related: Average Family Has Saved Enough to Send One Kid to College for Half a Year
The report details how fewer parents fear the worst when it comes to the risks associated with college. Fewer parents are worried that their child won’t find a job after graduation, that their income will decline because of layoffs, and that there will be an increase in student loan rates. As confidence has increased, fewer families are using cost-saving techniques, such as having students live at home.
Another factor contributing to the willingness of parents to spend on education is the improving stock market. The average size of a 529 account, the popular college savings investment plan, continues to grow after the recession caused a downturn, hitting a balance of $20,474 as of December 1, 2014. That figure tumbled to $10,690 at the end of 2008, according to data from the College Savings Plan Network.
Although parents may be feeling better about paying for college, the basic trend of increasing prices continues, and loans are still a big part of the funding picture. Between 2001 and 2012, average undergraduate tuition almost doubled, causing an average real rate increase of 3.5 percent each year. Nearly 71 percent of college graduates left school with student loan debt this year, up from 54 percent 20 years prior. The average debt was $35,000 in 2015, an increase of 34 percent from 2010, student loan-tracker Edvisors has found.