If you’re anything like most Americans, you’ve probably noticed something has been missing from the labor market recovery of the past few years: rising incomes. Even as the unemployment rate nears pre-recession territory, wages have stubbornly stagnated. America is still waiting for a raise. Even as the unemployment rate dropped to 5.5 percent in January, wage growth was lackluster at just 0.1 percent over December. For the past 12 months, wages have risen 2 percent.
What those numbers fail to illustrate is the magnitude of our malaise. The typical American household takes in about $52,000 before taxes. After adjusting for inflation, that’s less than a similar household earned in 1989, and not appreciably more than median household income in 1973 ($49,200). In four decades, these typical families have managed a cumulative raise of just 5 percent.
Related: Americans Are About to Get a Nice Fat Pay Raise
Now, imagine a world in which the labor market patterns that prevailed from World War II to the 1970s continued right up until the present day. How much more would the typical American household be earning per year?
$51,000.
That’s right. If post-World War II trends in productivity growth, labor force participation, and income equality had persisted, middle-class Americans would be earning double what they actually do today. Six-figure incomes would be the norm. Instead, we’ve seen productivity languish, participation plummet, and inequality soar— and raises vanish.
These figures come from the 2015 Economic Report of the President (ERP), the most important economic policy document the White House produces each year besides its budget proposal.
While the troubling trends the report identifies are long-lived, they hold special relevance for the painful paradox we’ve experienced in recent years: Unemployment is falling, but earnings aren’t rising. In theory, this makes no sense. When the supply of workers shrinks relative to the demand for them, wages should increase. It’s Econ 101. So what gives?
Related: 5 Million Job Openings, So Why Can’t You Get Hired?
The answer goes right back to three trends covered by the White House report: participation, productivity and inequality.
Half the Battle Is Showing Up
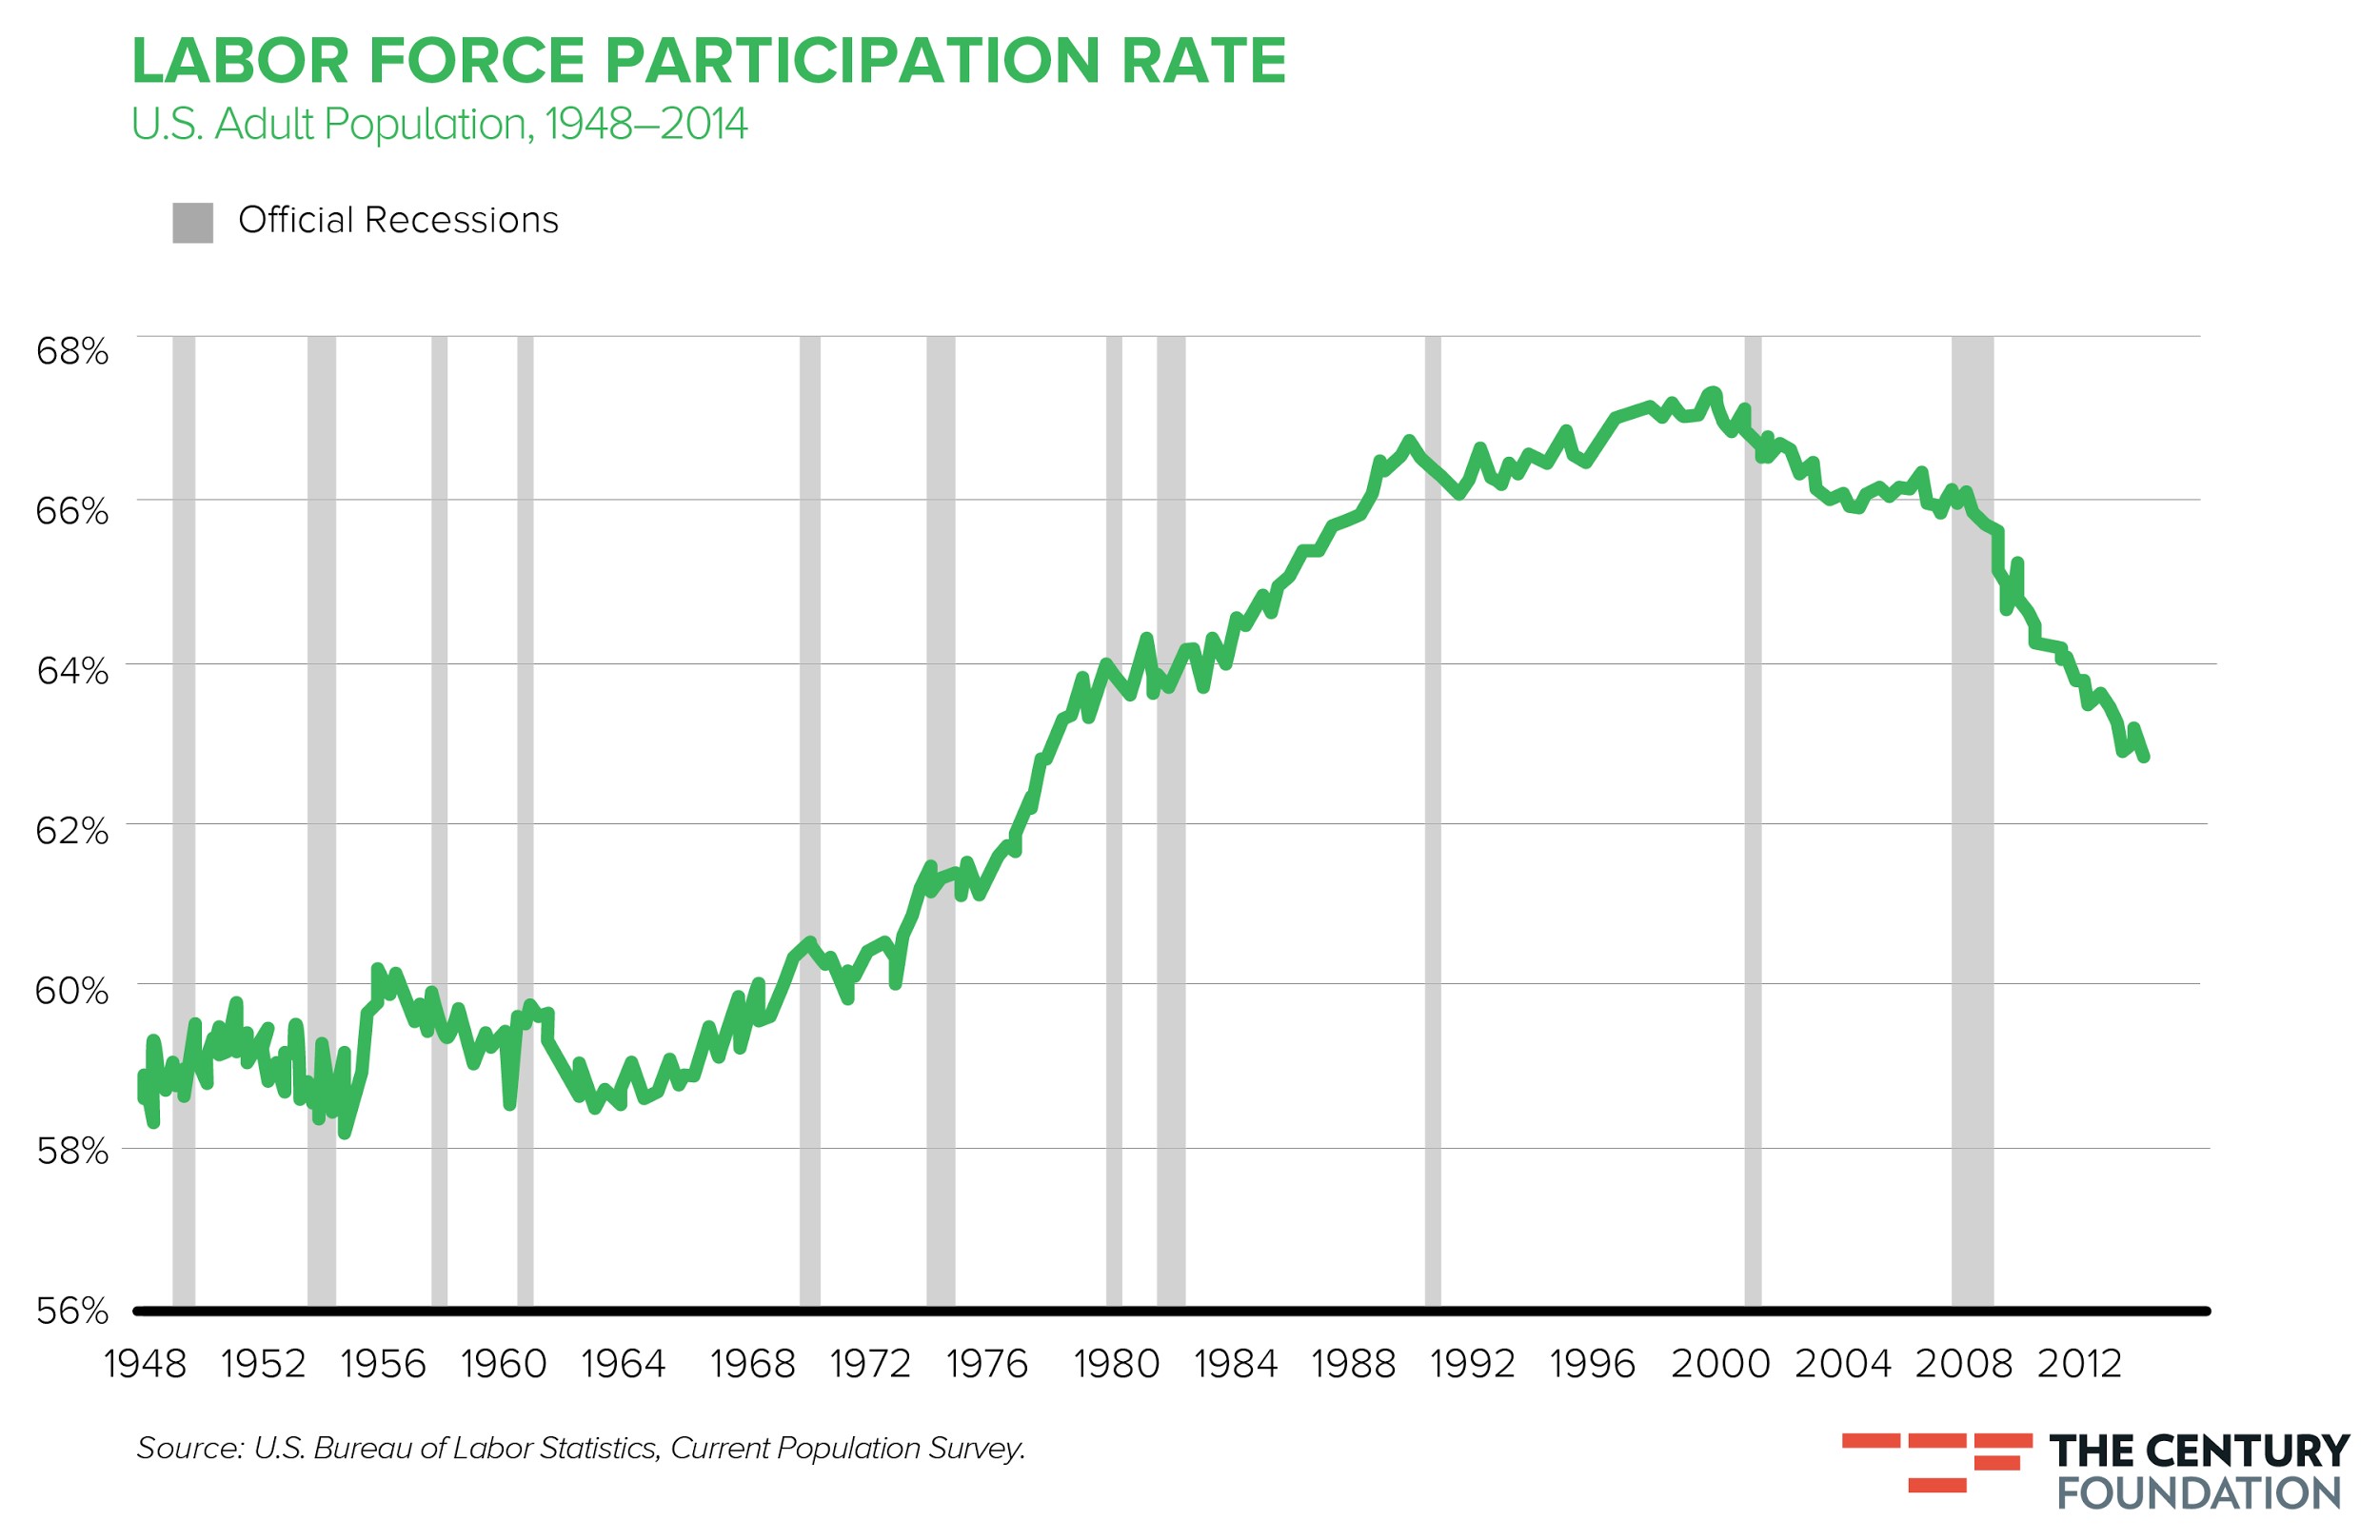
First, participation. As it turns out, the labor market isn’t as tight as the unemployment rate indicates. Since 2007, labor force participation has fallen 3.1 percentage points, from 66.0 percent to 62.8 percent. Some decline was expected due to the aging of the population, but demographics explain about only half the drop; moreover, among prime-aged workers 25-54 years, participation has decreased by 2.0 percentage points.

What does this have to do with your paycheck?
You might think that fewer active job seekers — those officially labeled as “unemployed” — would necessarily imply tighter labor markets and higher wages. But exactly the opposite can be true. As it turns out, about half the workers who gain employment in a given month were formerly not active in the job market, which means that many people who say they aren’t interested in jobs actually are, competing with the officially unemployed to find work.
Related: The Real Reason Walmart Is Raising Worker Pay
When participation is falling, as it is now, a decline in the unemployment rate doesn’t necessarily mean a one-for-one decline in the number of job seekers, but rather that the composition of the applicant pool is changing — with those who are less connected to the working world moving back toward it.
This compositional shift is also evident among the officially unemployed themselves. One of the sorry legacies of the Great Recession has been an unprecedented uptick in long-term unemployment (episodes lasting six months or more), which, as a share of overall unemployment, rose to 45.8 percent in 2011 from its average of 16.6 percent in the decade preceding the financial crisis. Though it has retreated recently, the long-term unemployment share is still 31.1 percent — far above the historical norm.
When disconnected job seekers comprise a larger and larger portion of the labor pool that is bad news for wages. It’s well documented that the longer you’re out of work, the more difficult it is to find a job. Not only do skills atrophy and networks evaporate, but employers are hesitant to hire those blemished with long layoffs. According to the White House report, a third of those unemployed less than a month find work in the next month; for those unemployed more than a year, the number drops to 8 percent. People not actively participating in the labor market are in a similar spot. And thus, unemployment feeds on itself.
Related: Why Federal Workers Are Better Off Than the Rest of Us
As you might imagine, this doesn’t put either group in a particularly strong place when it comes to wage negotiations—so the larger the share of disconnected workers in the applicant pool, weaker will be pressure on wages.
You Earn What You Make...
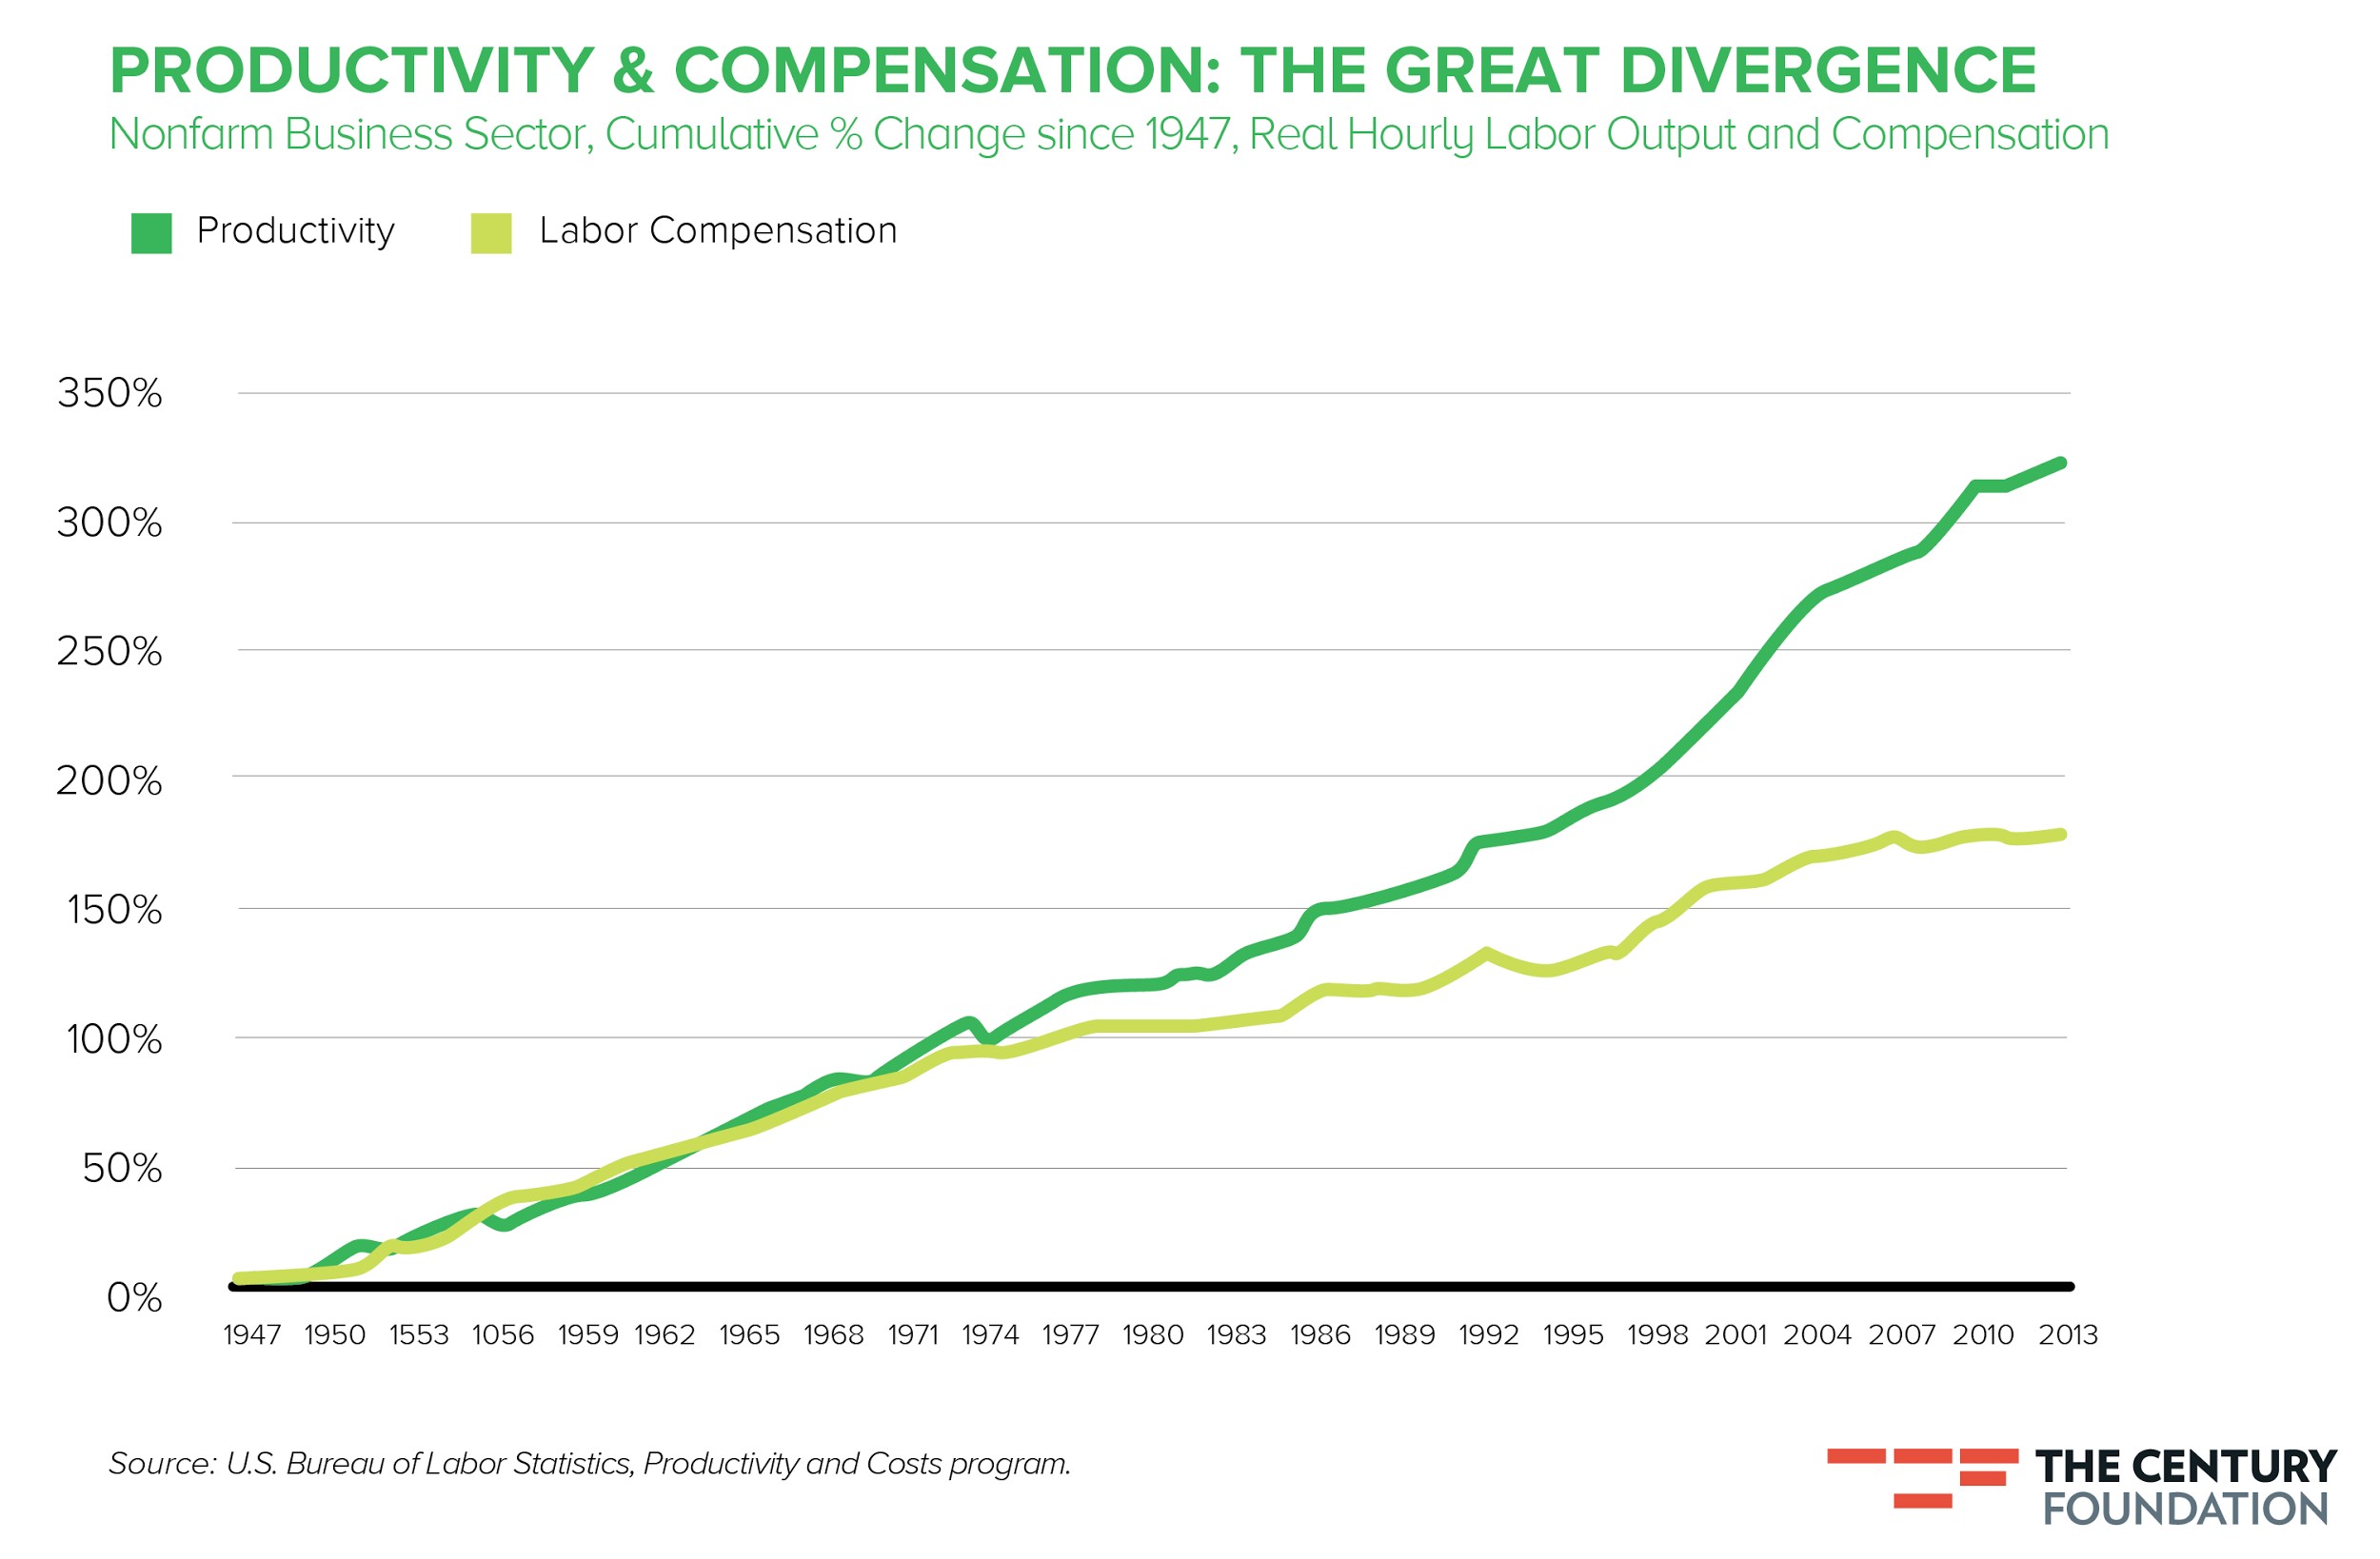
To make matters worse, labor productivity has been weak. Since 2011, it’s grown just 0.7 percent annually — a far cry from the 2.1 percent annual growth it averaged during the previous 30 years, and the 2.4 percent it averaged in the three decades before that. Because workers are paid (roughly) in proportion to what they produce, slow productivity growth means slow wage growth.
While labor productivity depends on numerous factors, the primary explanations for the slowdown are weaker growth in business investment, employee educational attainment and technological innovation.
...Except There’s More to the Story
As disappointing as recent productivity growth has been, earnings growth has been even slower. Since 2007, labor productivity is up 10 percent, while average hourly earnings of production and nonsupervisory employees (a good proxy for a typical worker’s earnings) is up just 4 percent. Going back even further, productivity has grown 108 percent since 1973, while inflation-adjusted earnings are actually down 7 percent.

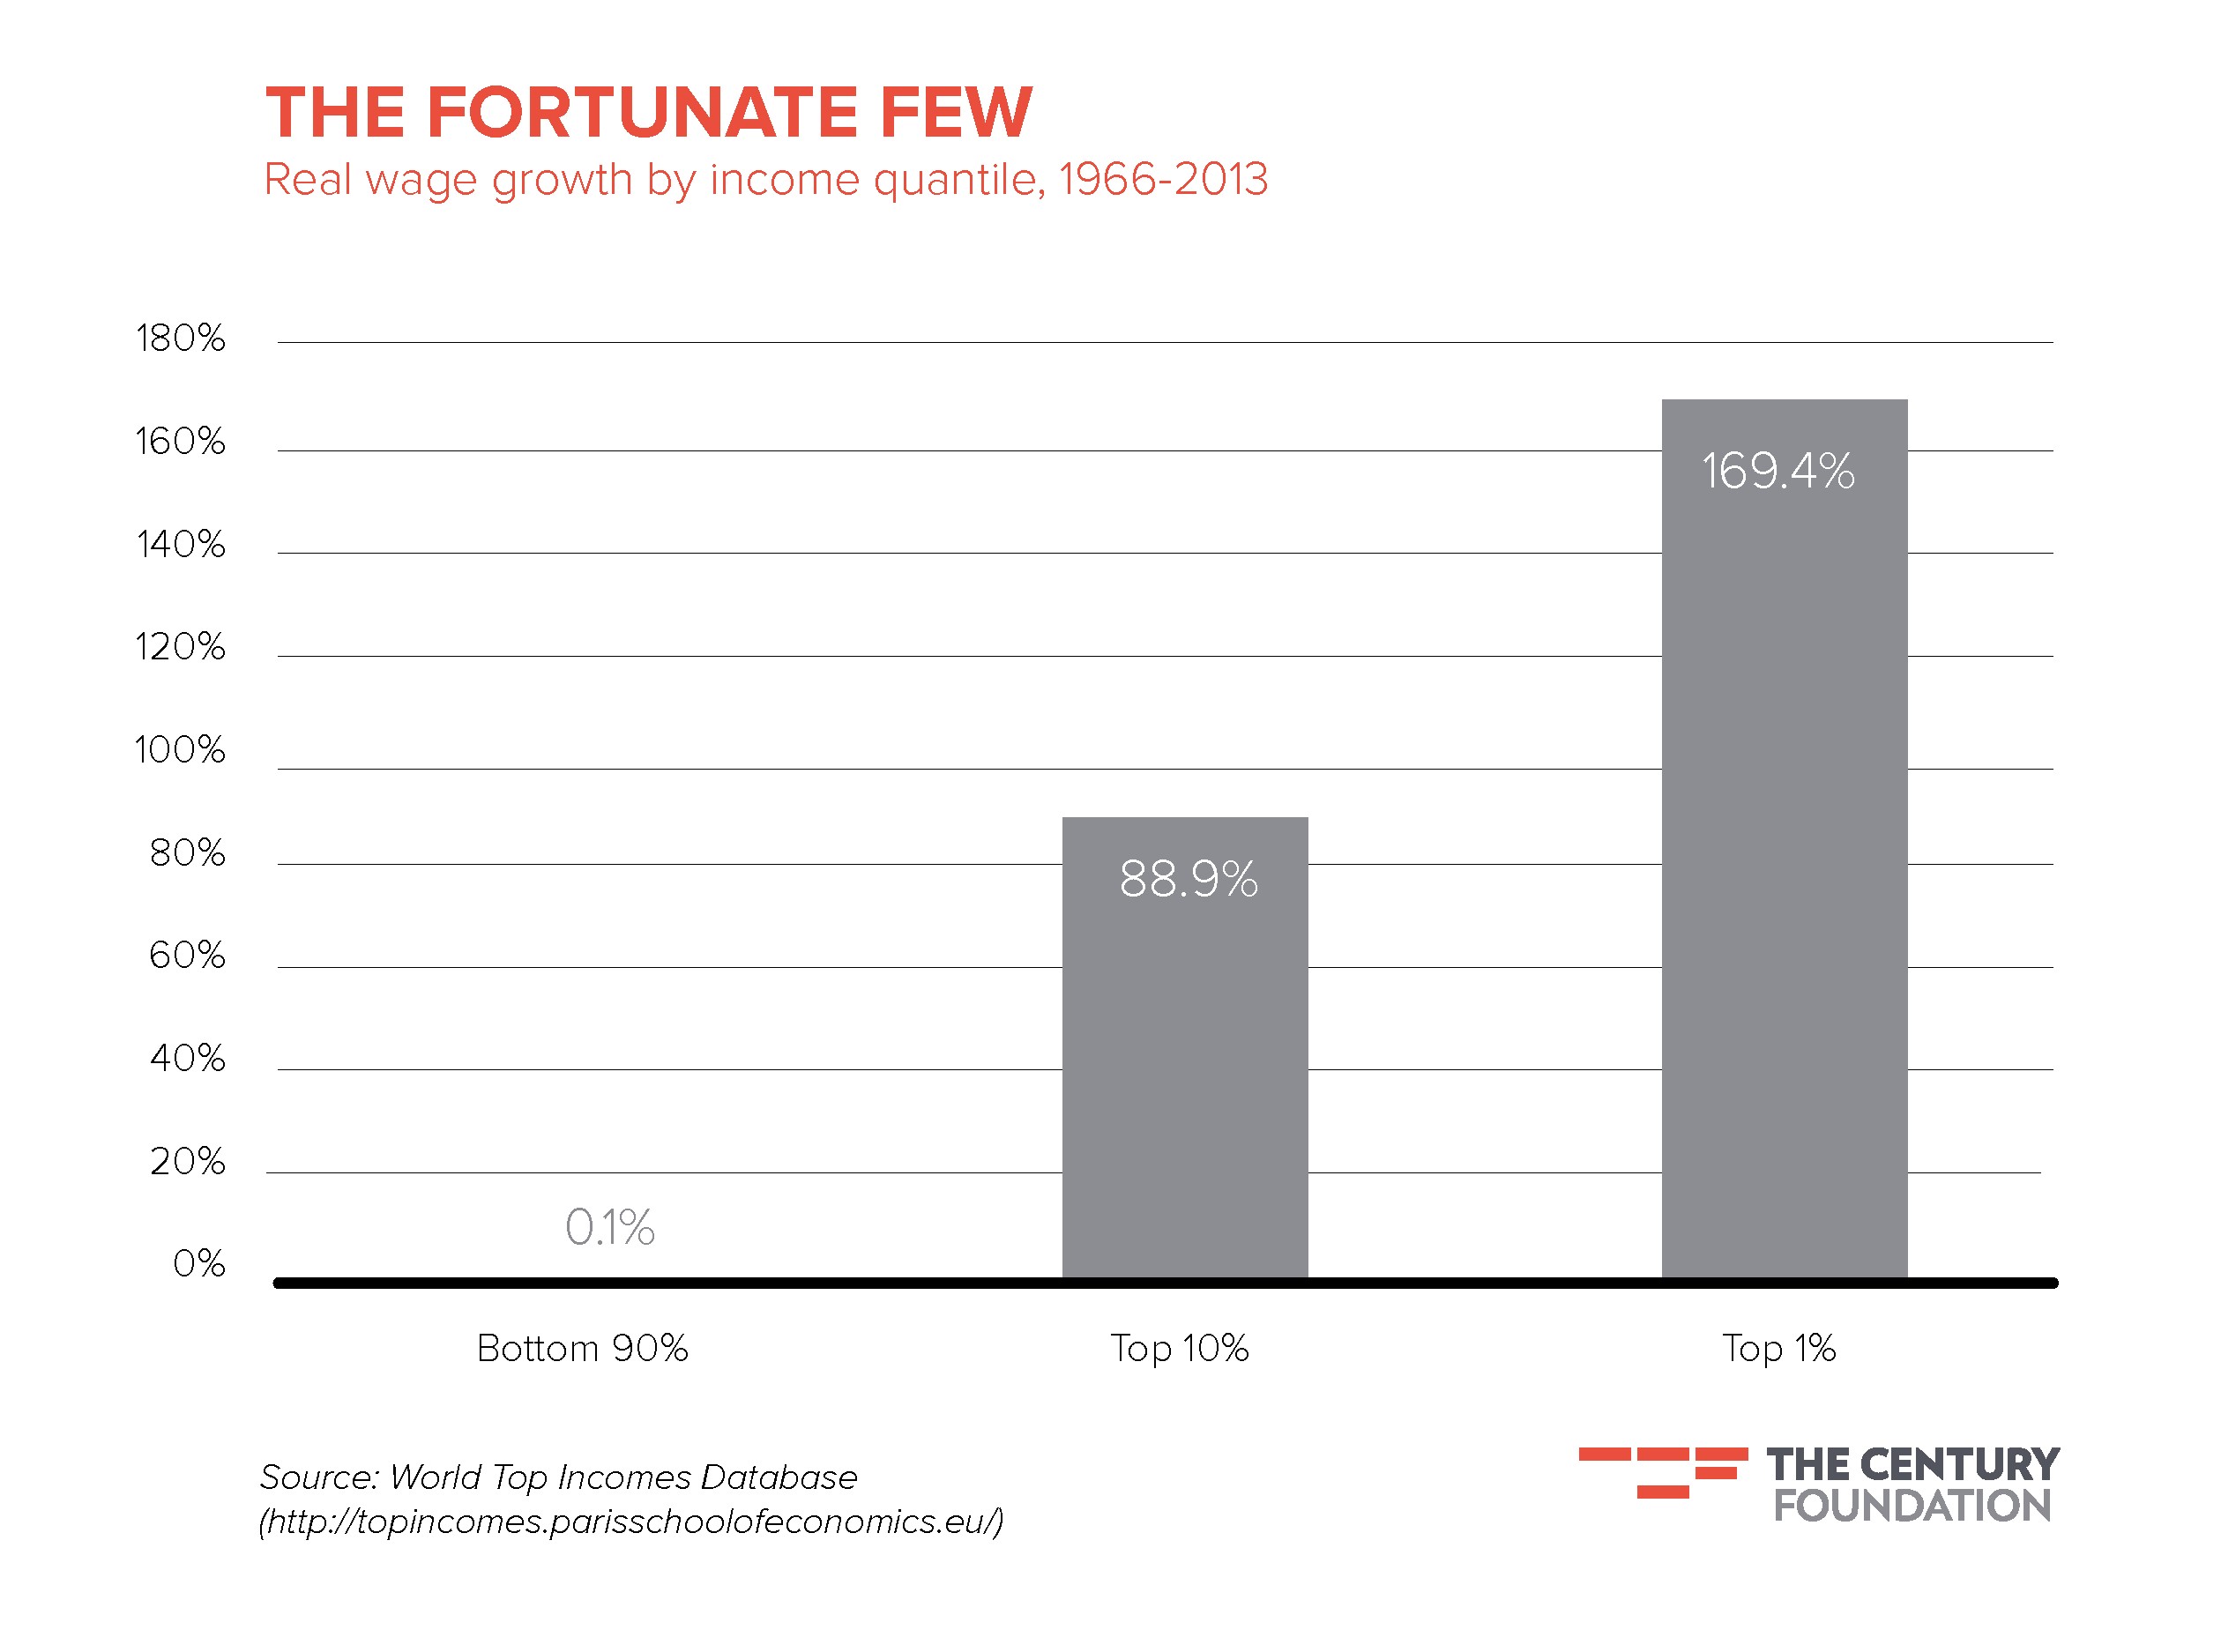
This remarkable divergence between what workers make and what they earn has a societal consequence: inequality. And that’s the third point of the White House report. To the extent we’ve seen incomes rise during the past several decades, most of the gains have gone to fortunate few — the very top earners.
Related: The Incessant Myth of the Growing Wealth Gap
Consider this startling fact: If the income distribution today were the same as it was in 1966, the bottom 90 percent of earners would have about $1.9 trillion more income. That’s about $6,700 per person, or $27,000 for a family of four. Instead, during the past five decades, we’ve seen the average income of those in the top 10 percent increase by 89 percent, while income growth of the bottom 90 percent has been… 0.1 percent—in other words, nothing. And it’s even more skewed at the very top, with the top 0.1 percent of Americans enjoying a 340 percent raise.

It’s Time To Make Your Case
So, if you’re upset about not getting that raise, take solace in the fact that (a) you’re not alone, and (b) it’s probably not your fault. Instead, a slack labor market, a secular downturn in productivity and a vastly unequal playing field are to blame.
In America, we tend to accept market outcomes as inevitable and infallible — but we shouldn’t.
Related: Why Middle Class Tax Relief Is Taking Center Stage
As the White House economic report explains, policy choices make a difference. Business tax reform, increased public spending on infrastructure and expanded access to college can jump-start productivity. Addressing discrimination in hiring and providing work supports such as paid family leave and child care can enable more Americans to participate in the workforce. And limiting the worst excesses of the executive suite while pursuing a smarter, more stimulative fiscal agenda can help remediate some of the avoidable inequalities that divide us.
In short, you won’t be $51,000 richer unless Americans support the kinds of policies that help the average worker. It won’t be easy. But, as with getting a raise, change often only comes when we have the courage to demand it.
Top Reads from The Fiscal Times:


